Version: Yurbi v11
Role: Builder or higher
Permission: Builder access to the application
In this guide, you will learn how to create a new data grid report from scratch in builder. We will talk about the process and, the different options to configure when creating a new data grid report.
Accessing the Builder Section
Once logged in, click Builder option at the top of your dashboard

Creating the Report
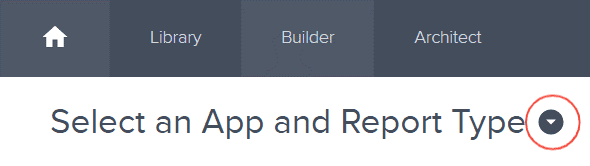
Select Application and Report Type
Click the down arrow next to Select an App and Report Type to open the dropdown menu.
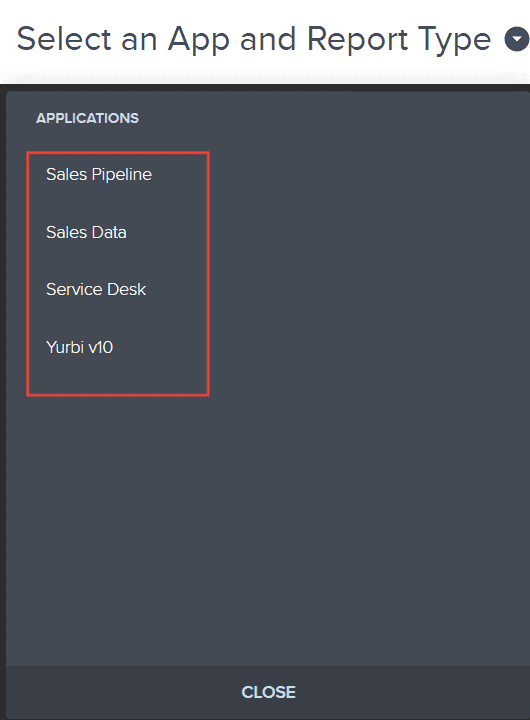
Choose the application you wish to build a report for. The options are the applications you are authorized as a report builder for.
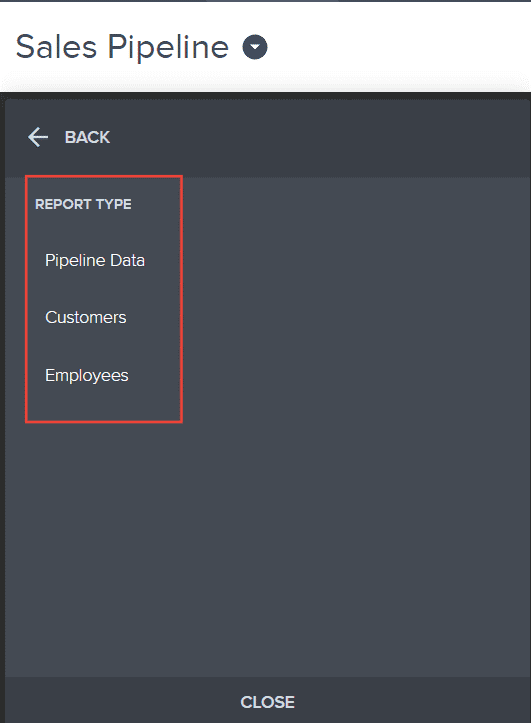
Now, pick the type of report you intend to create. Depending on the application, different report types will be available for your selection.
Building Your Report
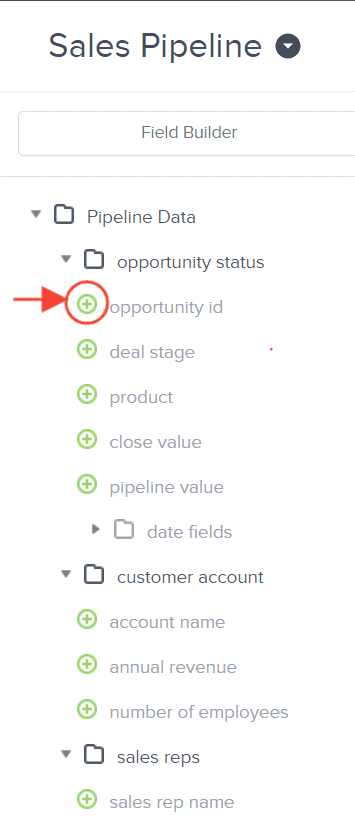
With a report type selected, a report tree will appear. This contains all possible fields for your report.
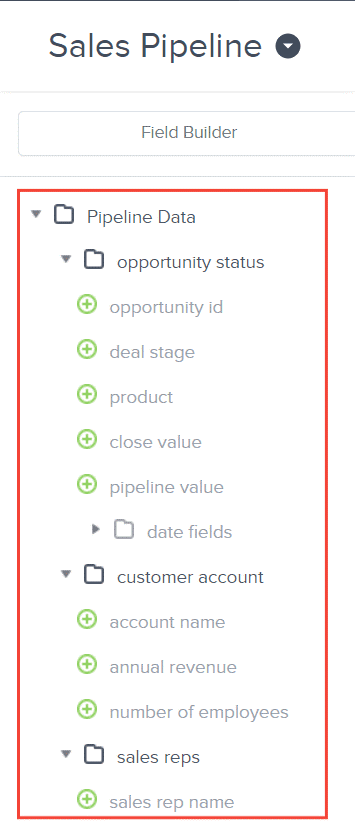
Click the plus icon (+) next to the fields you want to add. These will become the columns in your report and will be reflected in the preview area.
Customizing Report Structure
This section includes steps on arranging the fields you have selected and deleting a field you want.
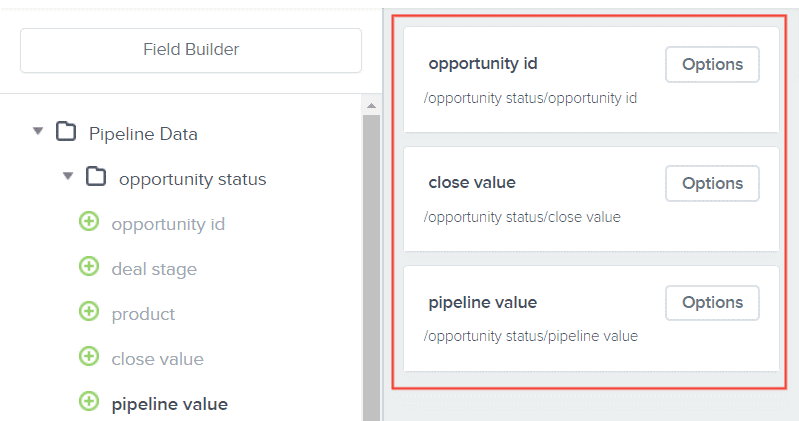
Once you have selected a field, you can customize each of them in the report fields.
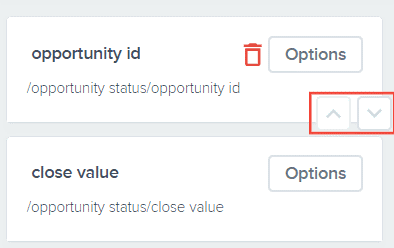
To rearrange columns, hover over a field to see up and down arrows, then click these arrows to move the field accordingly.
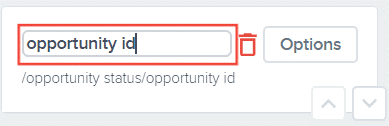
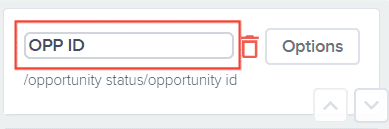
To rename a column, simply click on its name and type the desired new name.
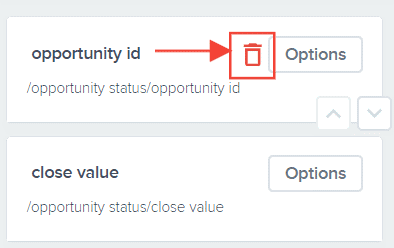
To remove a field, hover over it and click the delete icon.
Configuring Data in Report Fields
This section covers the different options available within a field and how each of these options are useful when creating a report.
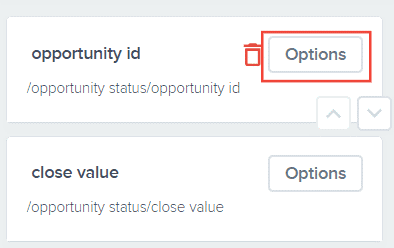
Each field features an options bar for more configurations
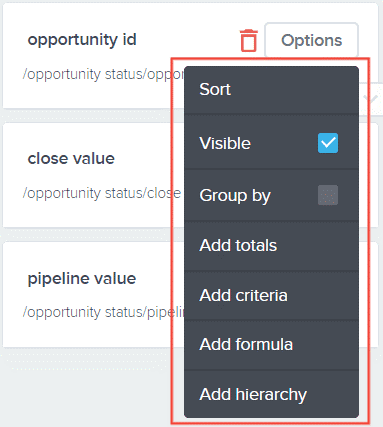
Sort: sort’s data of that field in either ascending or descending order
Visible: to make the field appear on the report. This is automatically enabled. Disabling this would make the field disappear on the report.
Group by: groups all selected fields into one column.
Add Total: Adds a total, subtotal, or percentage for numerical data.
Here is an article about configuring Add Total option
Add Criteria: Defines data filters for numbers, dates, or times.
Here is an article about configuring Add Criteria option
Add Formula: Implements calculations like those in Excel.
Here is an article about configuring Add Formula option
Add Hierarchy: Organizes data into groups within the report.
Here is an article about configuring Add Hierarchy option
Preview Your Report
On the preview section, you can see the fields you added and configured. By default, it would show a standard output.
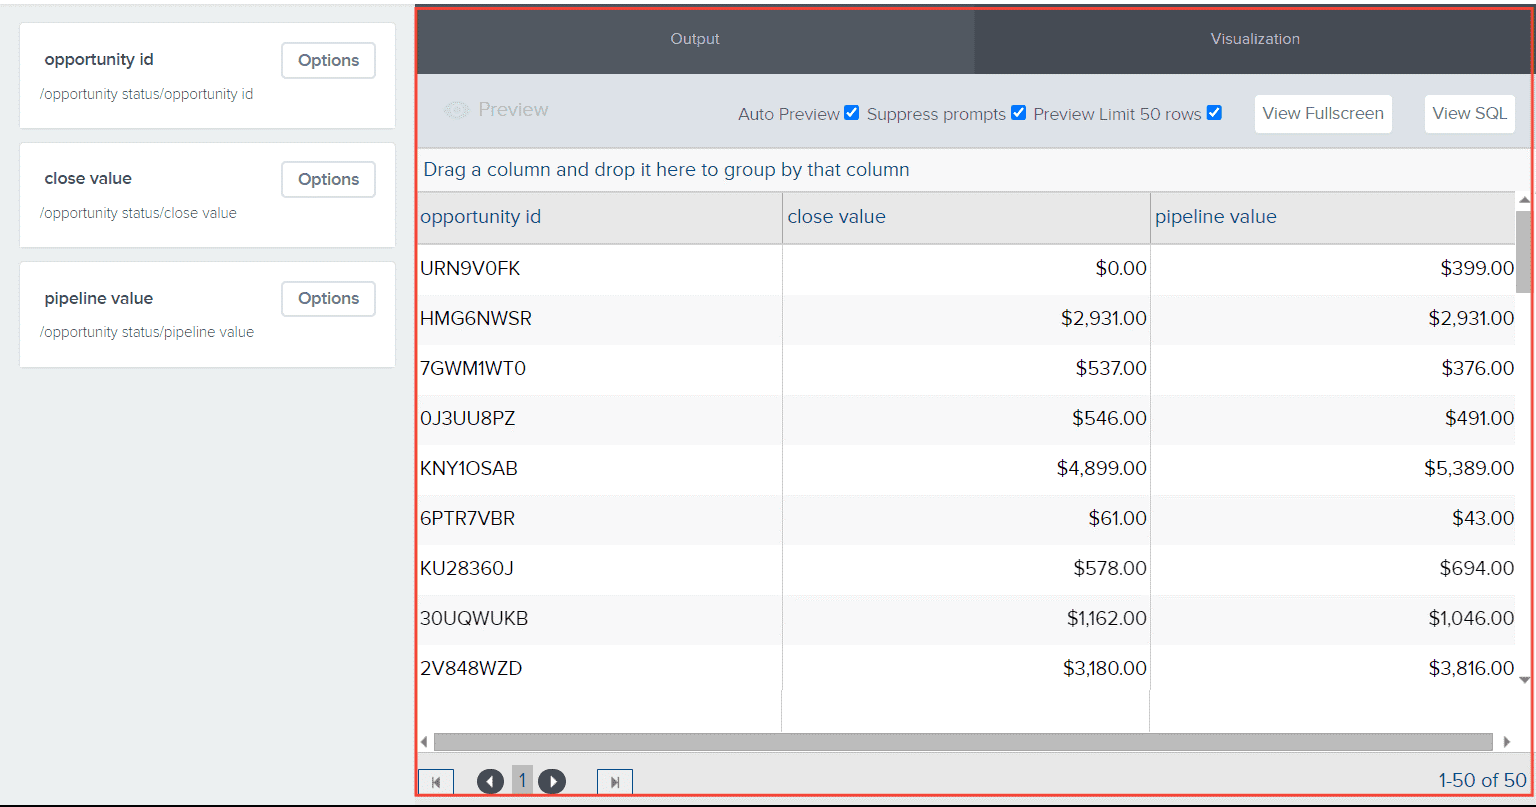
These three options are enabled by default in the preview section. Here are their functions:

The Auto Preview function is enabled by default, showing changes in real time.
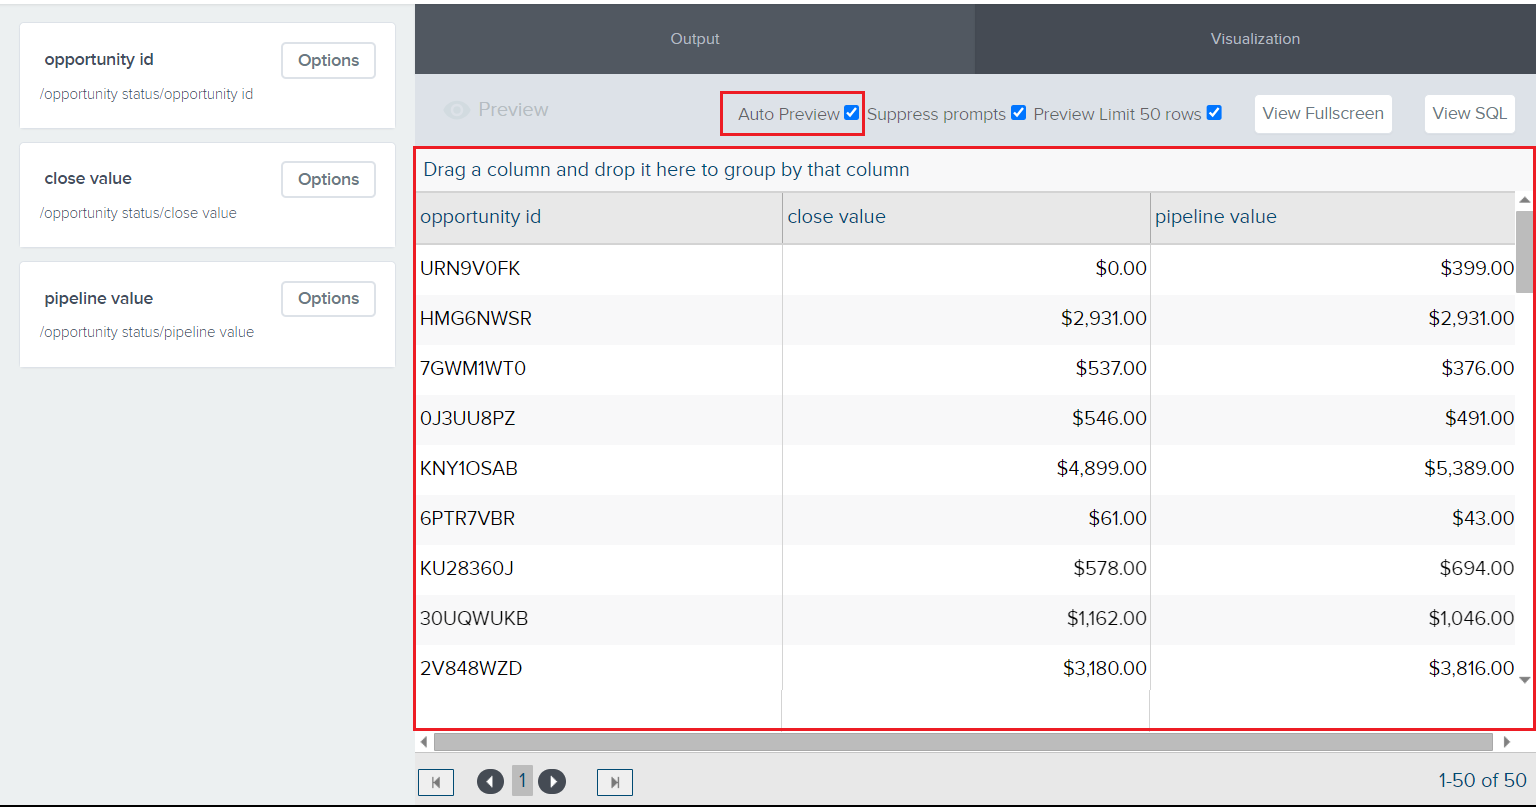
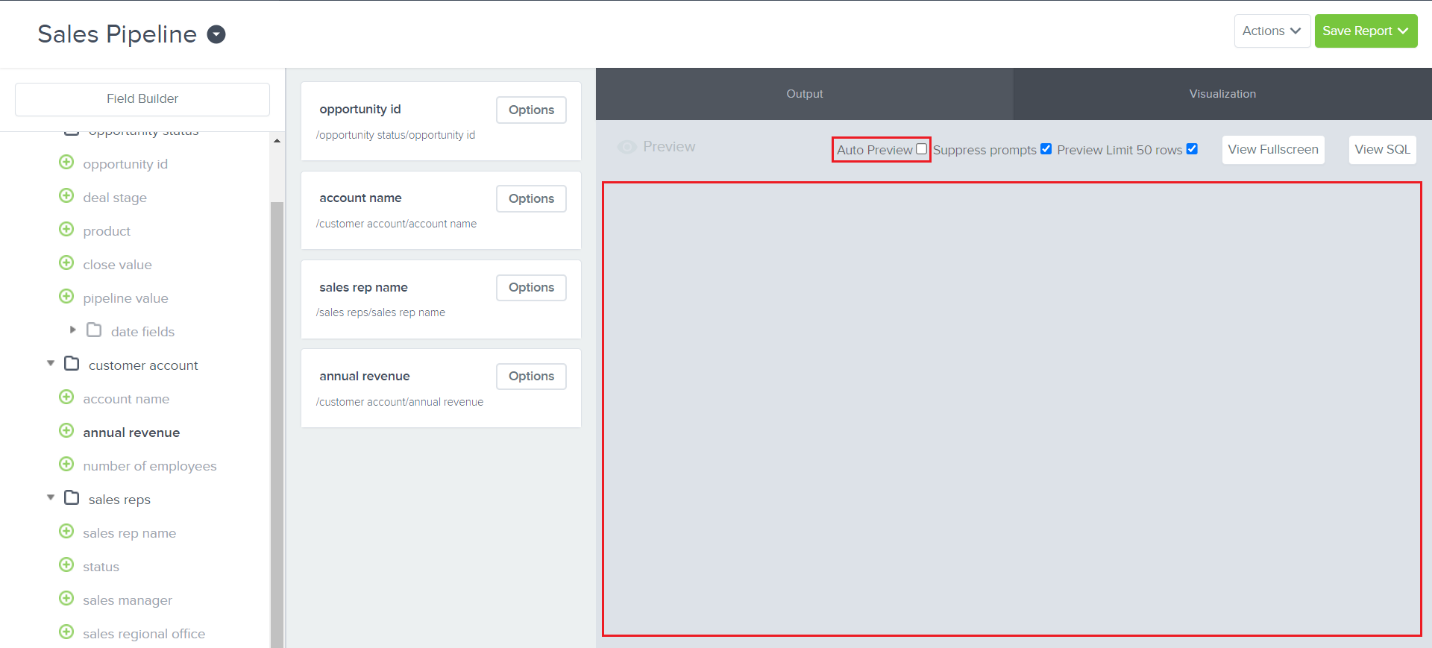
Disabling Auto Preview won’t bring any real time preview of the changes you have made.
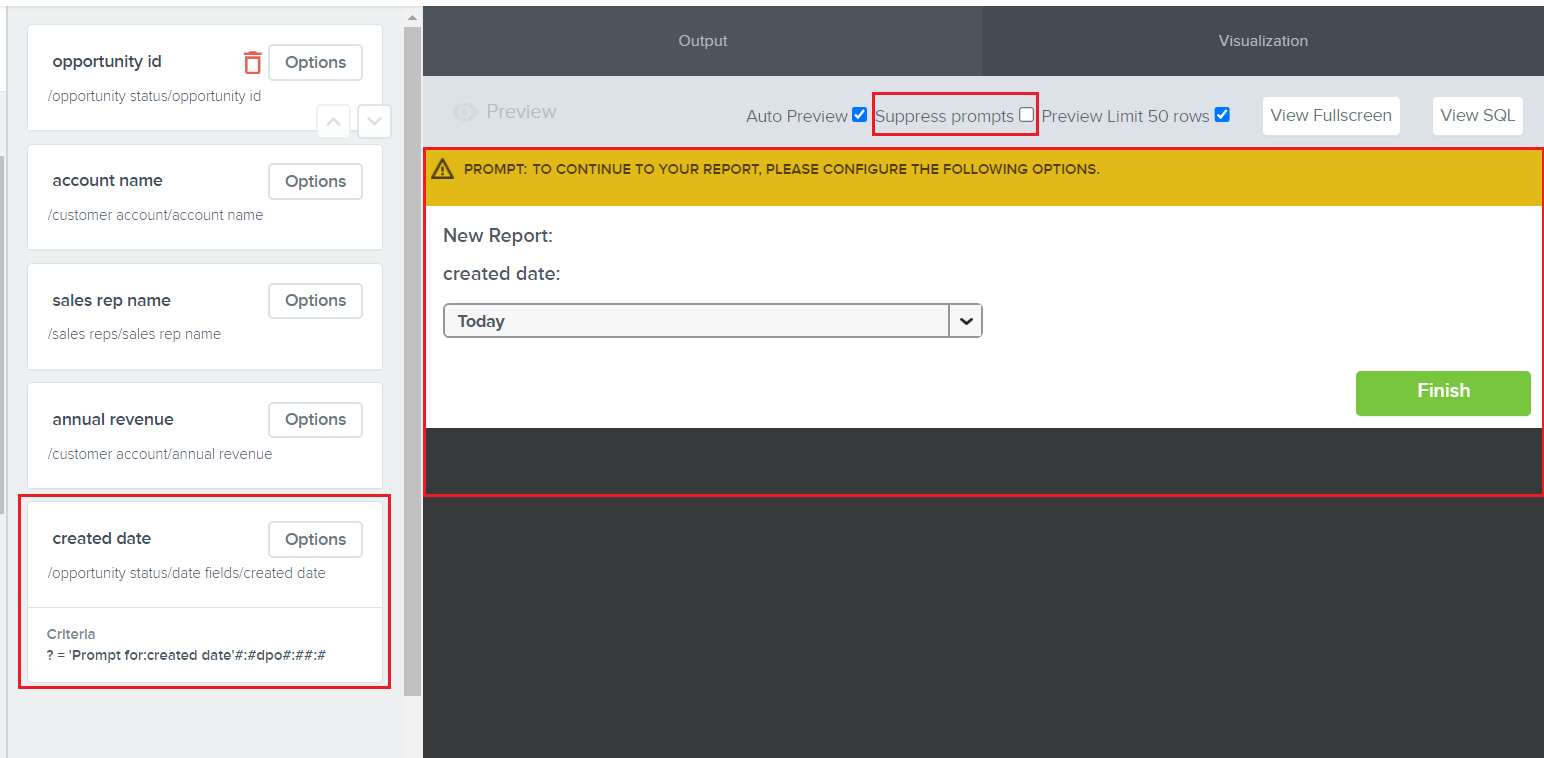
The Suppress Prompts is useful when a field has a prompt for values enabled. It suppresses the prompt in the preview section so that the prompt for values doesn’t keep appearing.
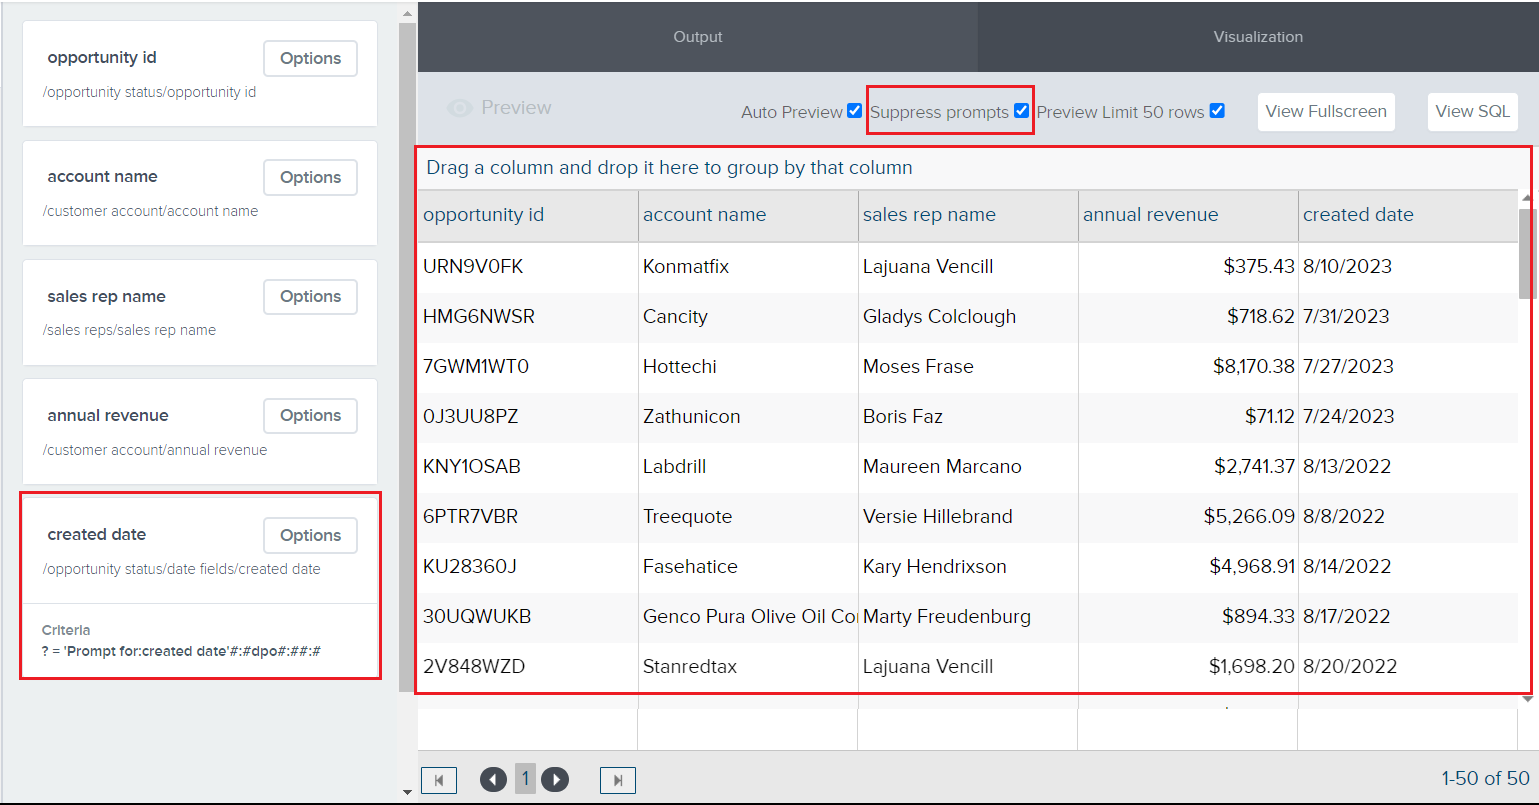
Disabling Suppress Prompts means that the prompt value will appear in the preview section, and you have to configure that prompt to be able to proceed with the preview of the report you are building. It will also appear when you click View Fullscreen.
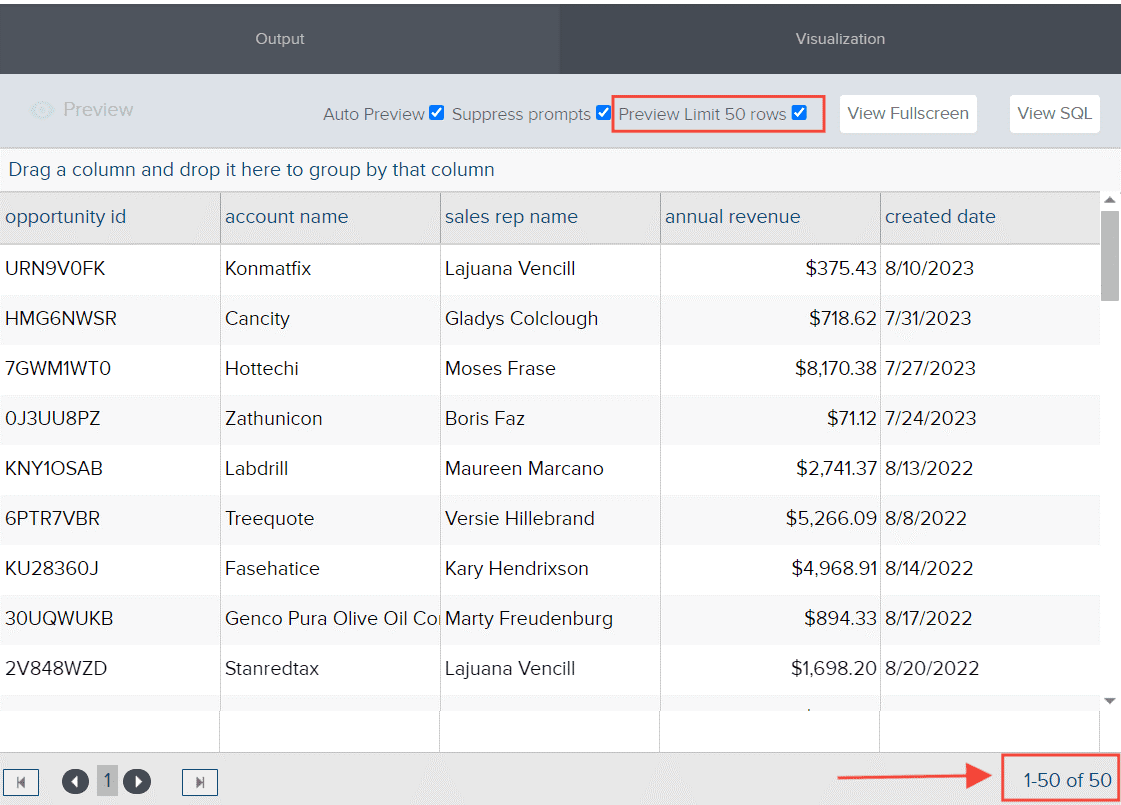
The Preview Limit 50 rows feature is set by default to load only 50 records at once, protecting the database from heavy queries.
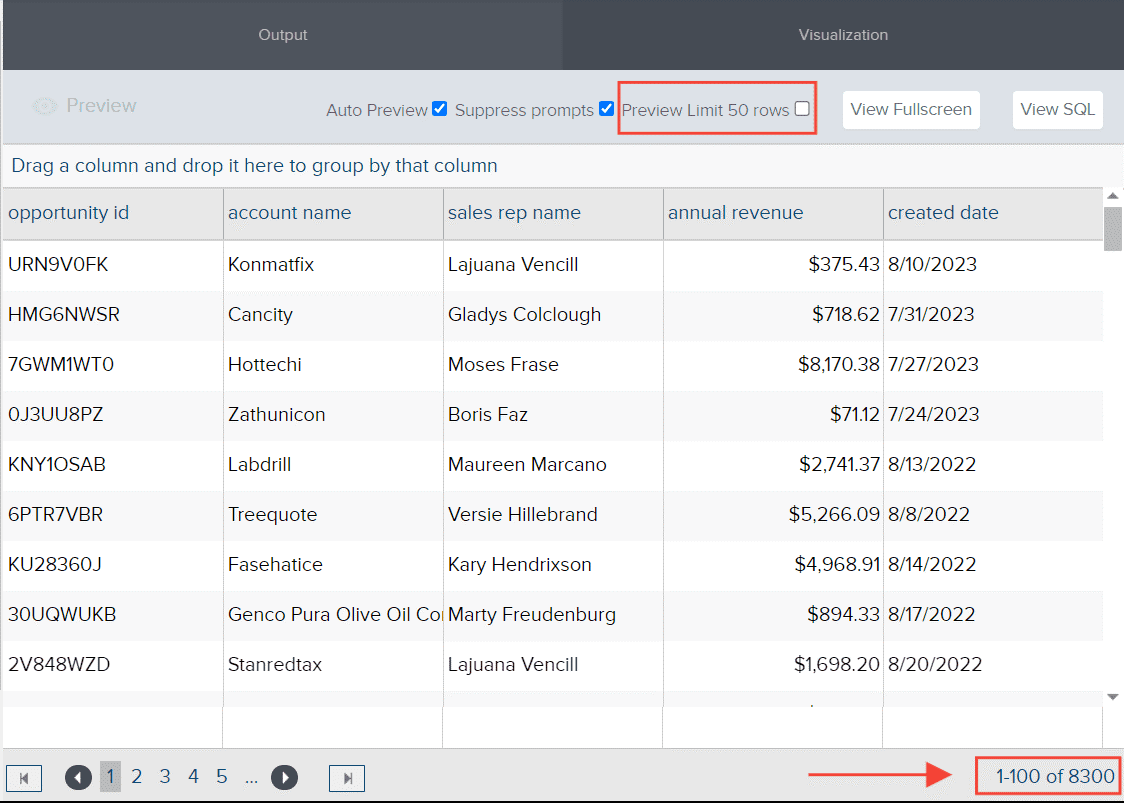
Disabling Preview Limit 50 rows will bring you all the queries related to the report you are building.
Clicking the Preview Button refreshes the preview section.

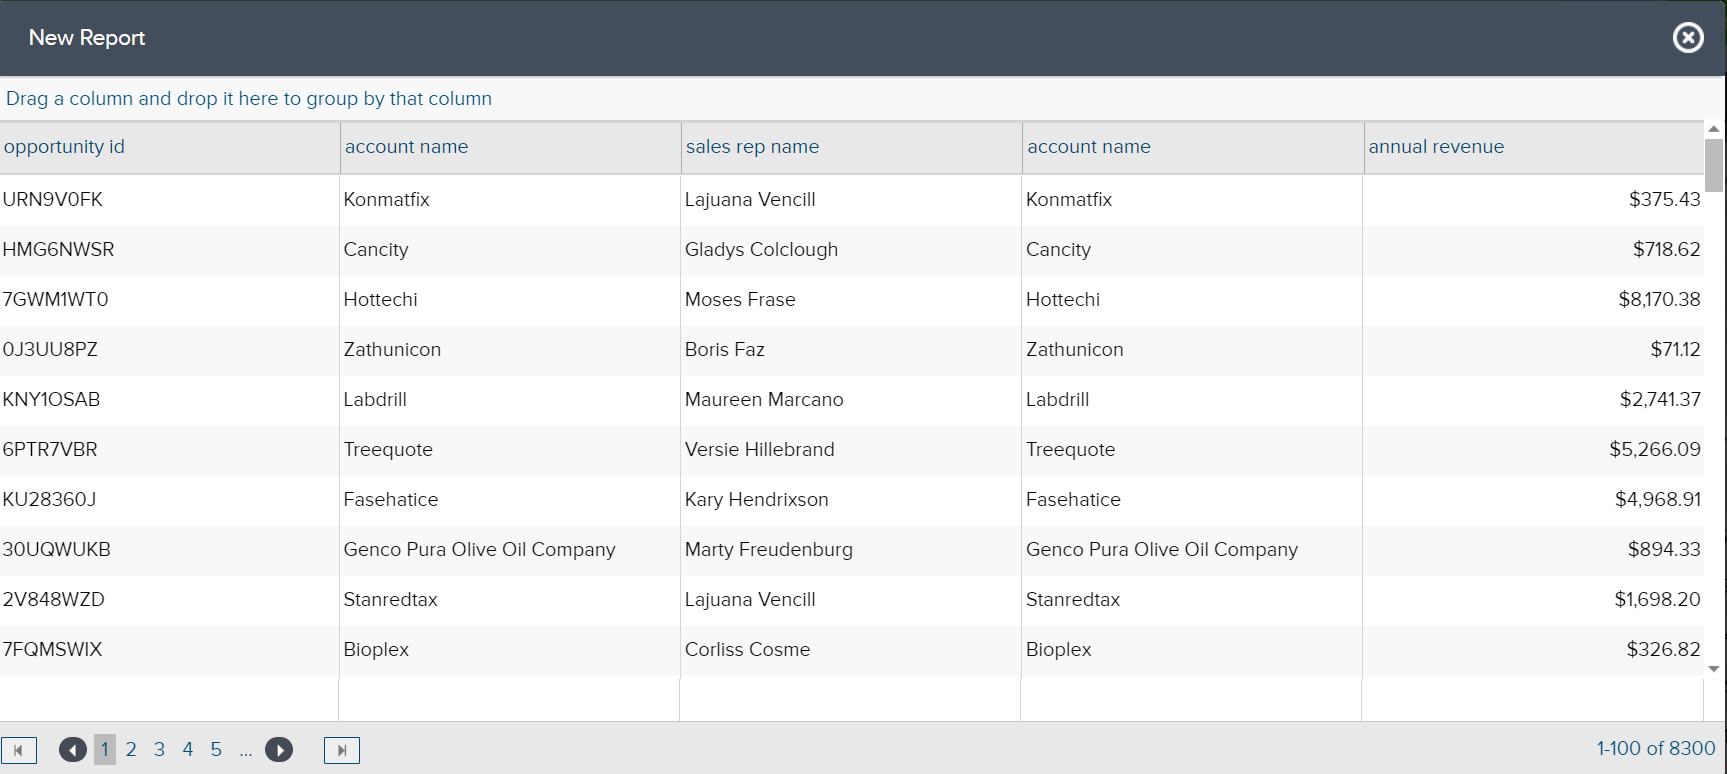
Clicking View Fullscreen gives you a full preview of the report that you are building via a pop-up box

By default, these additional settings are disabled. Here are the functions of each option and how they affect the report:
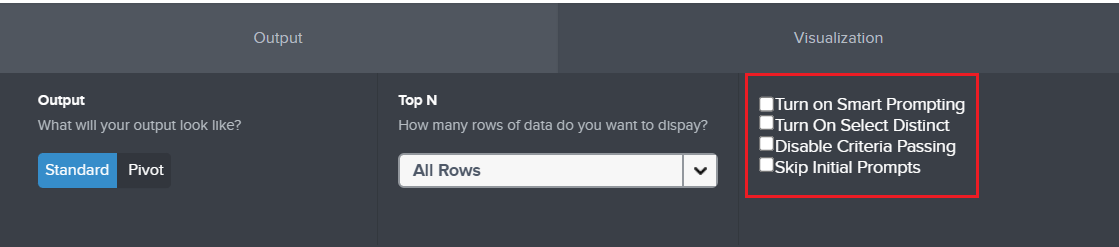
- Turn on Smart Prompting: This feature connects numerous independent enabled Prompt for Values of a fields report, similar to the Smart Filters functionality in a dashboard. After you set up the first prompt, following prompts will automatically refine their choices based on the selection made in the first prompt, creating a more integrated and intuitive filtering process. Once set, you can configure the prompt using the prompt panel without adhering to the sequence.
- Turn on Select Distinct: This option filters out duplicate entries within a field, ensuring that only unique data is displayed.
- Disable Criteria Passing: The checkbox is ticked off when creating an advanced report.
- Skip Initial Prompts: This setting permits users to bypass the default sequence of an active Prompt for Values of a field report. It presents a prompt panel where users can choose any prompt without following the set order. It is important to note that enabling this feature will disable Smart Prompting.
Save Your Report
Remember when creating a new report, the only option you can do is to save the report once you have finished configuring it. Overwrite and Save As won’t be available as the report your creating is not existing at the moment.
Once the report meets your needs, click Save Report.

Enter a Report Name and Report Description.
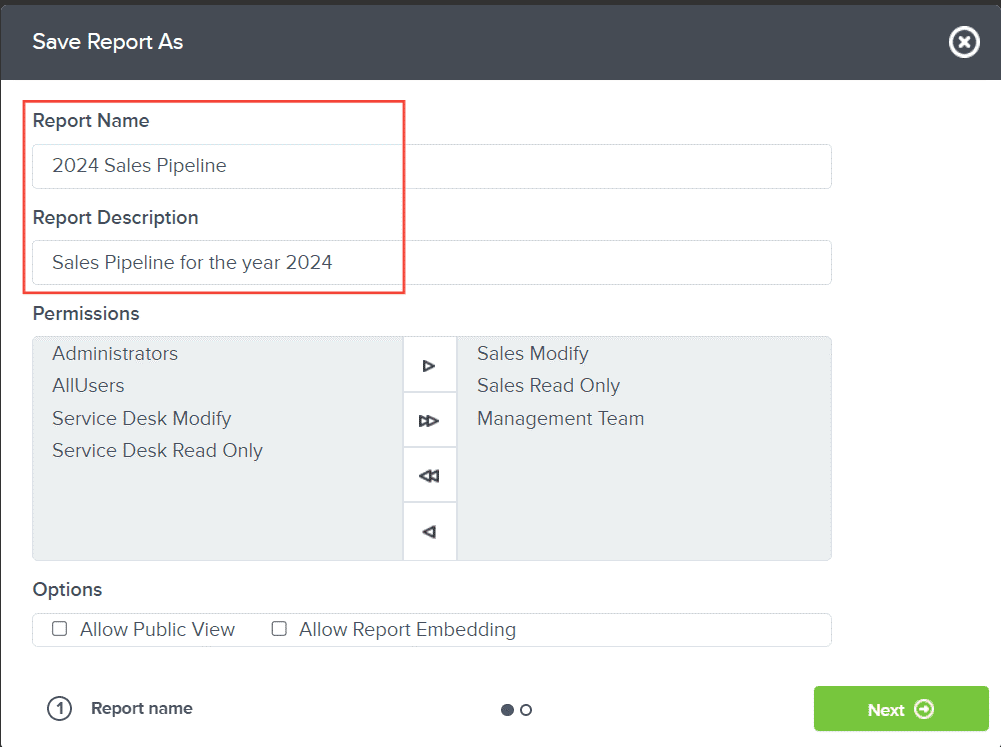
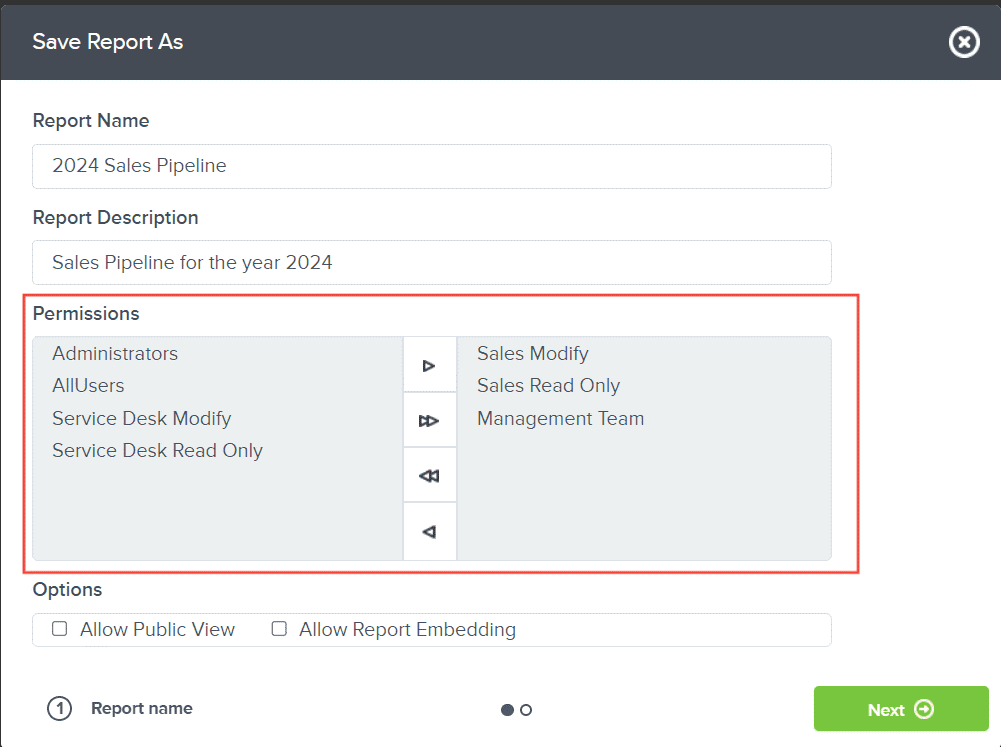
Choose Permissions for the report.
Click Next

Choose the folder where your report will be stored. If you haven't set specific permissions, the report will follow the folder's permissions.
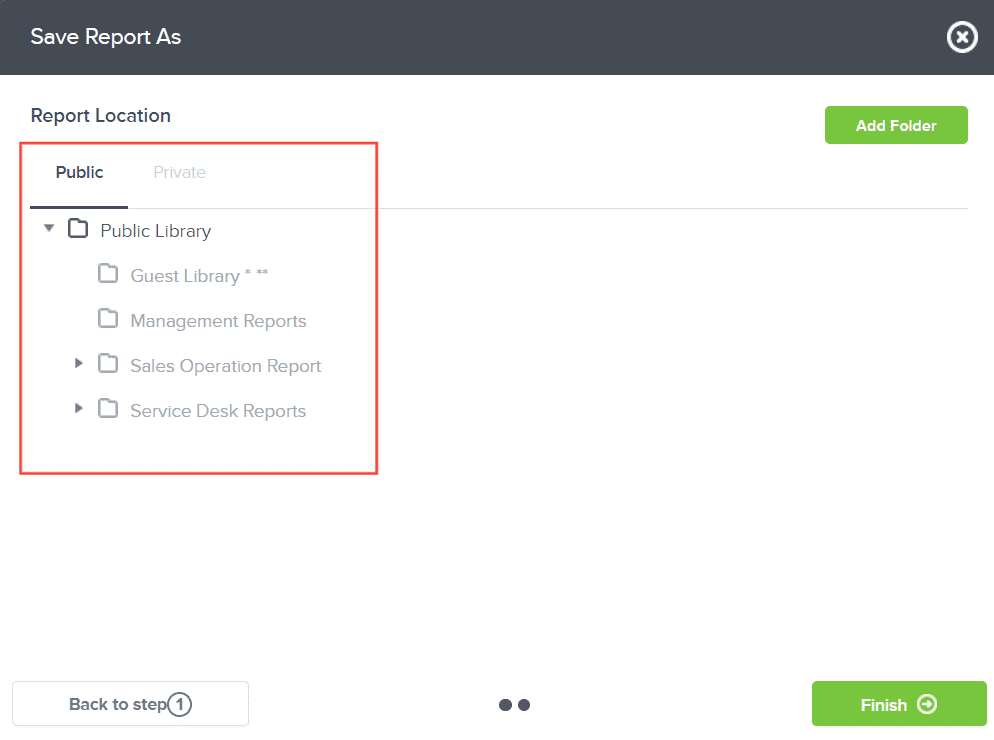
To complete the process, click Finish.

Your report is now created and saved in the selected location.
And there you have it! You now know how to create a report from scratch!