Version: Yurbi v11
Role: Builder or higher
Permission: Builder access to the application
In this guide, you will learn how to create a new pivot table analysis report from scratch in builder. We will talk about the process and the different options to configure when creating and editing a new pivot table analysis report. We will also cover how to create a pivot table analysis with a drill-down report.
Let us dive into the process:
Accessing the Builder Section
Once logged in, click Builder option at the top of your dashboard.

Creating the Report
This section covers the step by step of creating a report starting with selecting an app and then the report type.
Select Application and Report Type
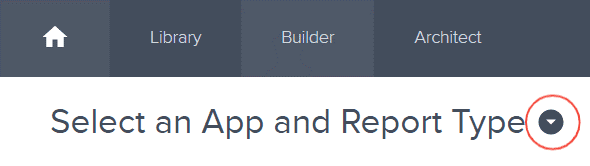
Click the down arrow next to Select an App and Report Type to open the dropdown menu.
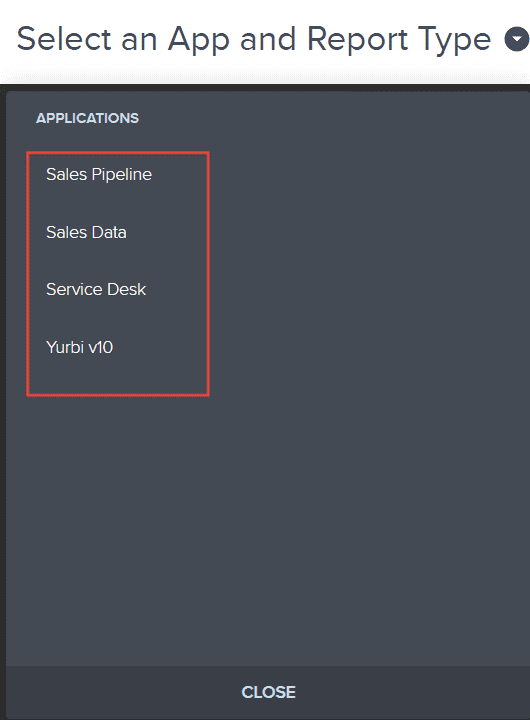
Choose the application you wish to build a report for. The options are the applications you are authorized as a report builder for.
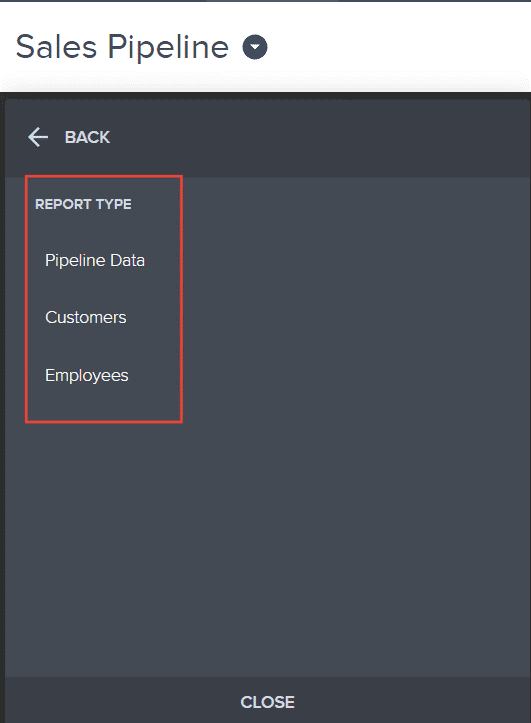
Now, pick the type of report you intend to create. Depending on the application, different report types will be available for your selection.
Building Your Report
This section covers the step by step of building your report starting with selecting your desired report fields to configuring the pivot table report.
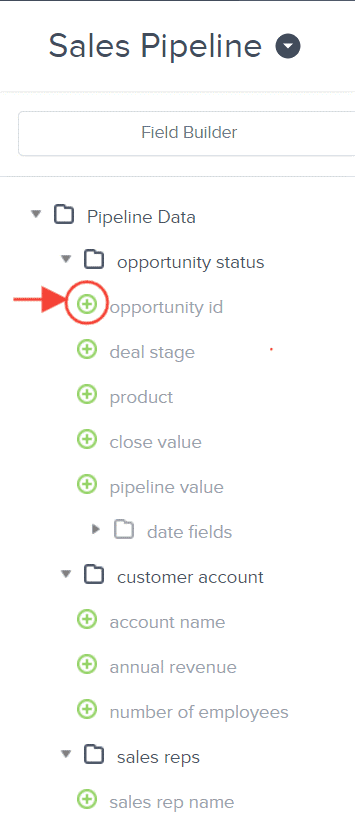
With a report type selected, a report tree will appear. This contains all possible fields for your report.
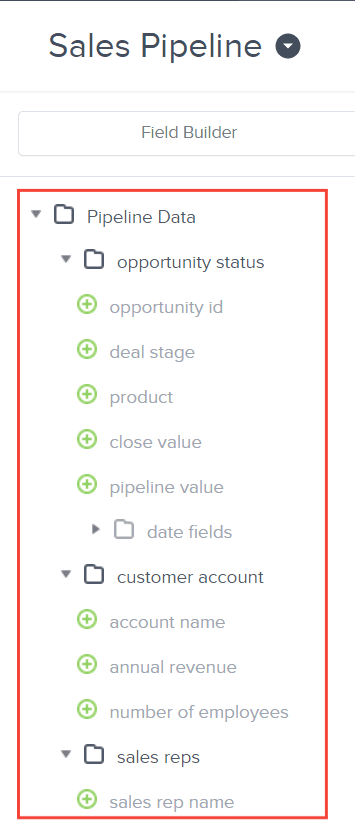
Click the plus icon (+) next to the fields you want to add. These will become the columns in your report and will be reflected in the preview area.
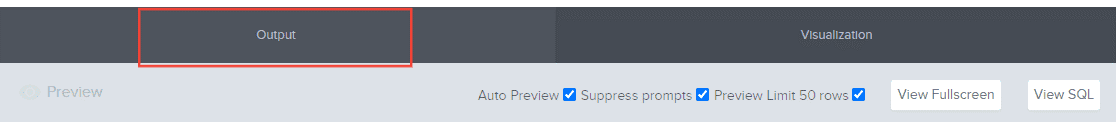
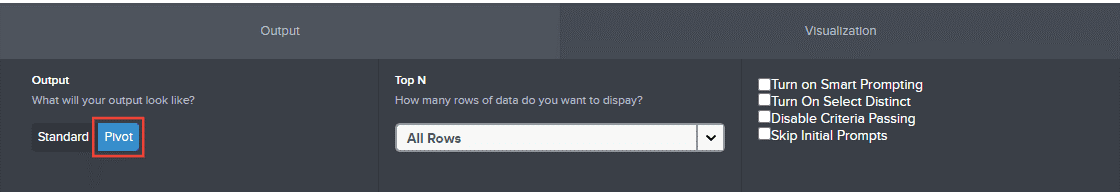
Click Output
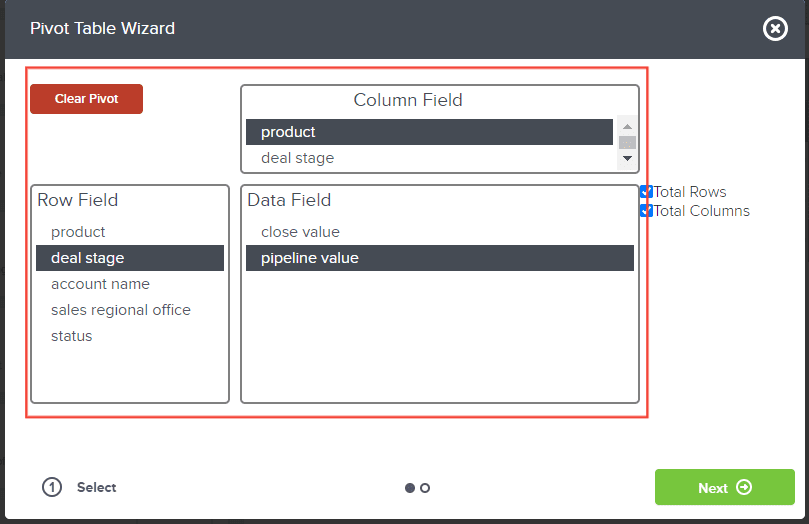
Select Pivot

Select the Column Field, Row Field, and Data Field. Available field for selection will be dependent on the report fields you’ve added.
Tick off Total Rows and Total Columns to show the total value of the data field selected in a column and row.
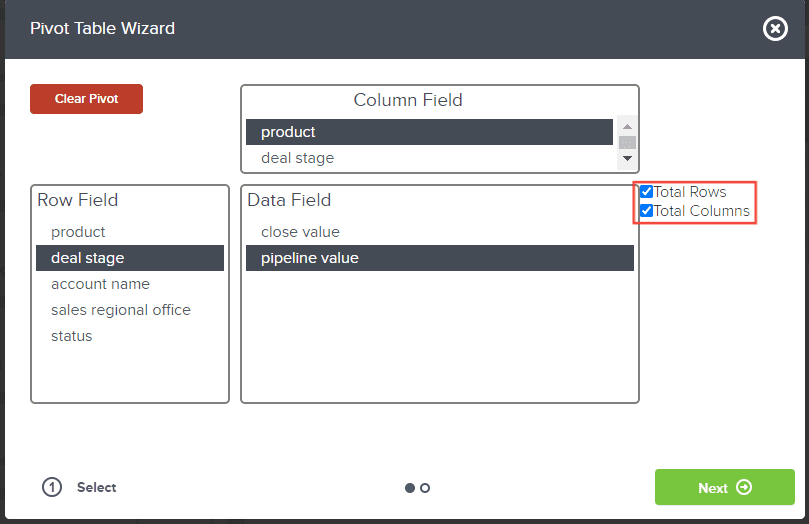
Click Next

Click Finish

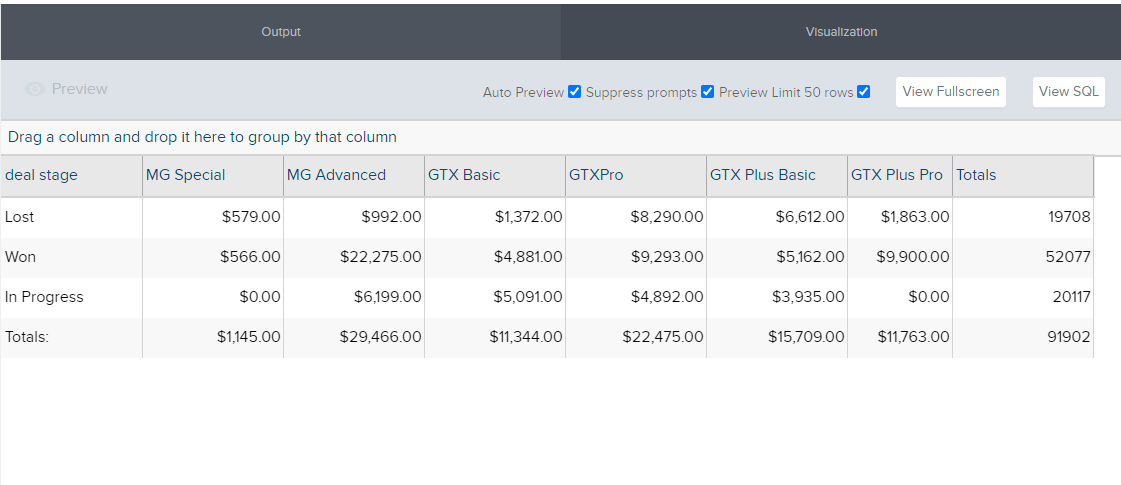
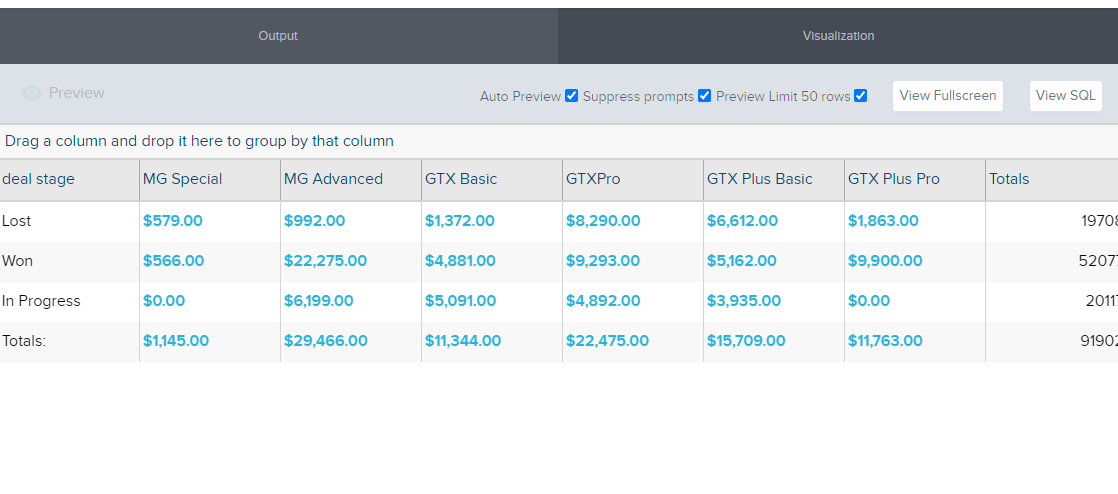
It will look like this in your preview section
Creating the Report with a Drill-down Report
This section covers the step by step process of creating a pivot table analysis report that includes a drill-down report.
After selecting the Column Field, Row Field and Data Field, and ticking off the Total Columns and Rows if there are any, click Next.

Click Select Target

Locate the report you want to use
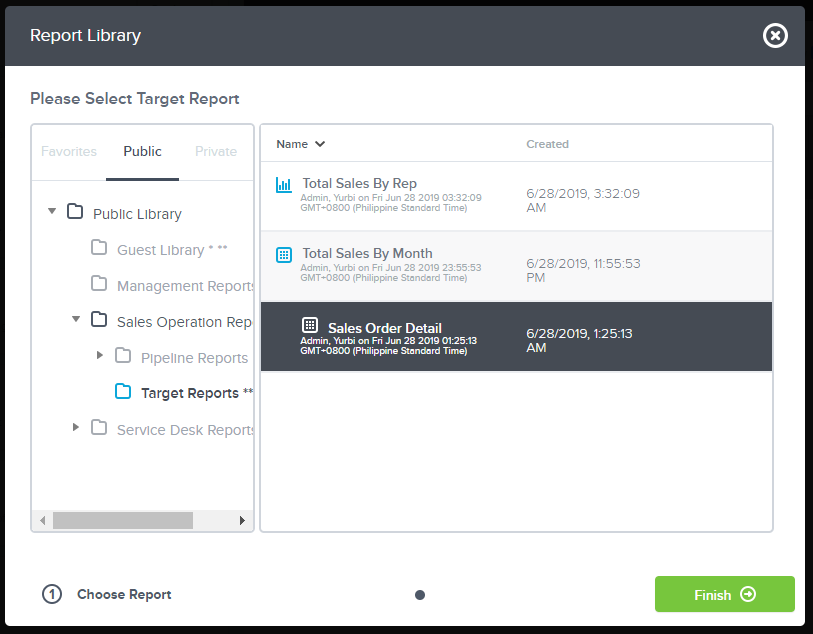
Click Finish

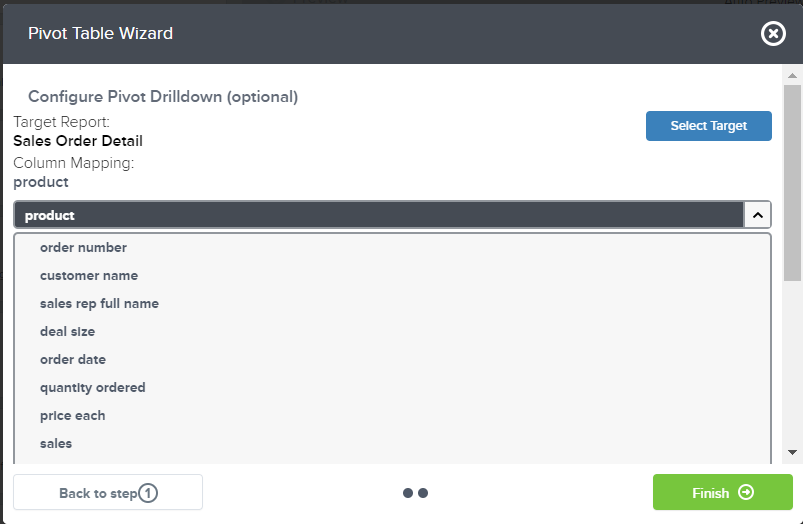
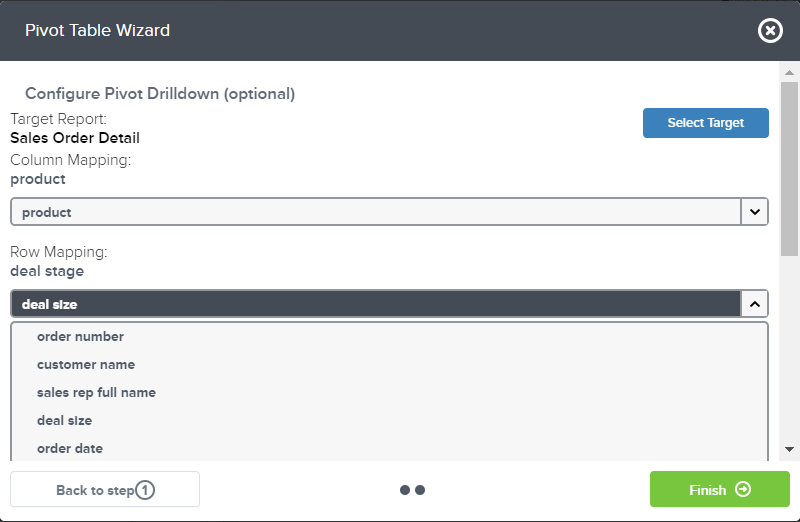
Under Column Mapping drop-down menu, select the appropriate value corresponding to the column field you have previously selected. Available for selection will be dependent on the selected report.
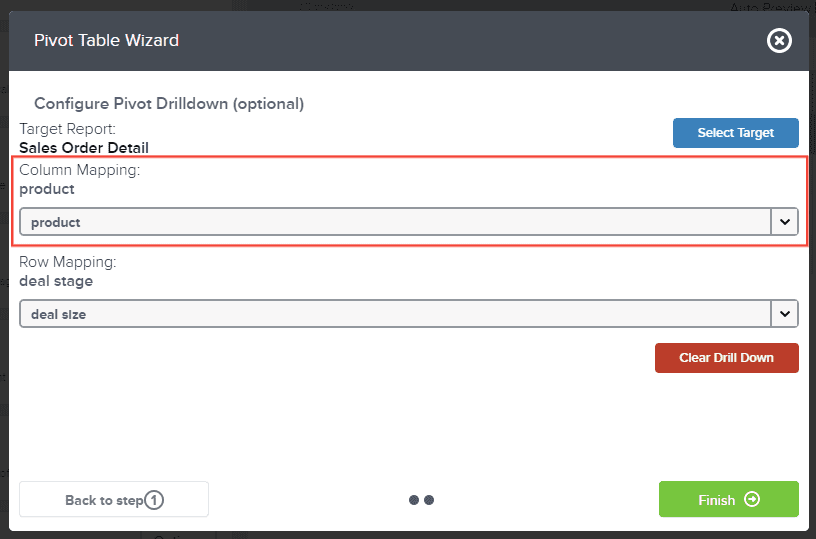
Under Row Mapping drop-down menu, select the appropriate value corresponding to the row field you have previously selected. Available for selection will be dependent on the selected report.
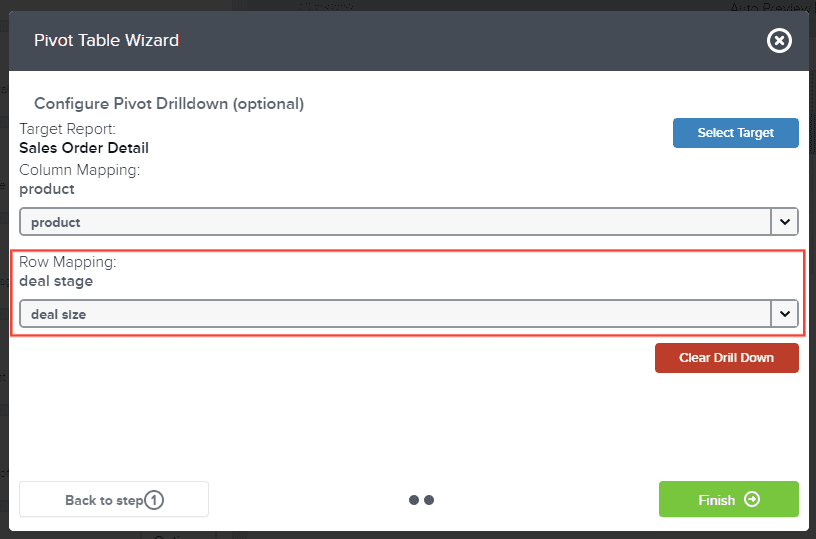
Click Finish

It will look like this is your preview section.
Editing the Report
This section covers on how you can edit a pivot table analysis report with or without a drill-down report included.
To edit the report, click Output

Select Pivot
Select the new column field, row field or data field you want to replace.

Uncheck or check the Total Column and Total Row as you desire.

If the report has a target report, follow the same steps as above in creating a report with a drill-down report, then click Next.

If you want to remove the selected drill-down report, click Clear Drill Down.
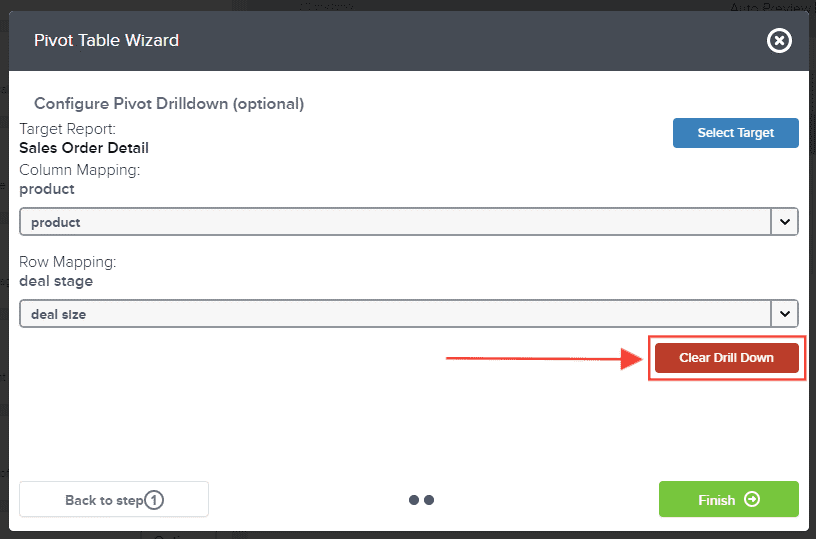
If you want to replace the selected target report, click Select Target and choose a new report to use.

And there you have it! You now know how to create a pivot table analysis and also create one with a drill-down report!