Version: Yurbi v11
Role: Builder or higher
Permission: Builder access to the application
Aggregate Grid Report offers more power and includes more total and subtotal features incorporated when configuring it than using the options menu in the report fields.
In this guide, we will talk about how to configure the report, the different uses of its aggregate function and how each configuration affects the report output.
Also, as of now, drill-down capabilities does not exist within the aggregate grid type of report.
Accessing the Builder Section
Once logged in, click Builder option at the top of your dashboard.

Creating Aggregate Grid Report
Select Application and Report Type
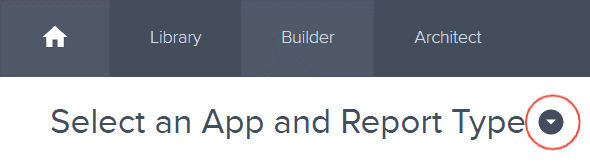
Click the down arrow next to Select an App and Report Type to open the dropdown menu.
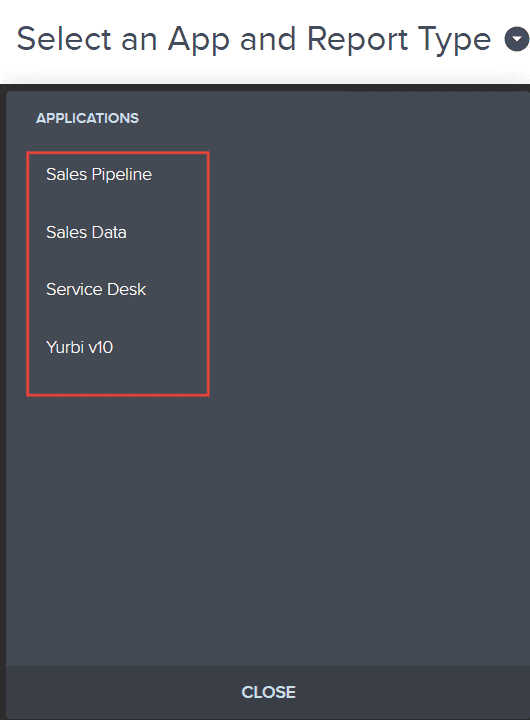
Choose the application you wish to build a report for. The options are the applications you are authorized as a report builder for.
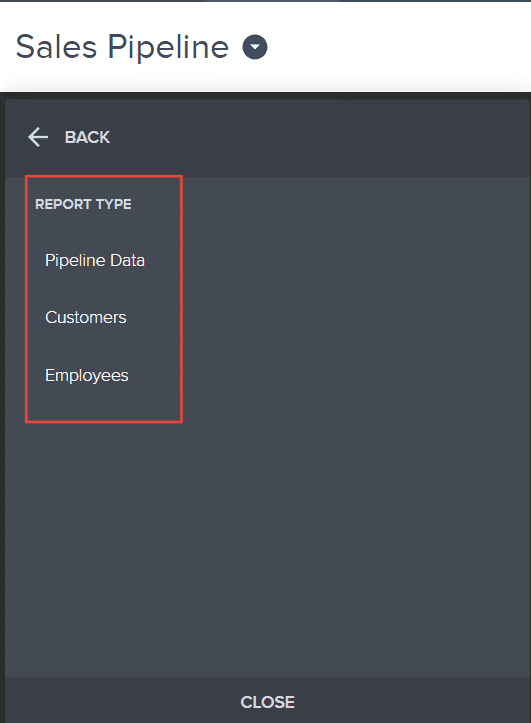
Now, pick the type of report you intend to create. Depending on the application, different report types will be available for your selection.
Building Your Report
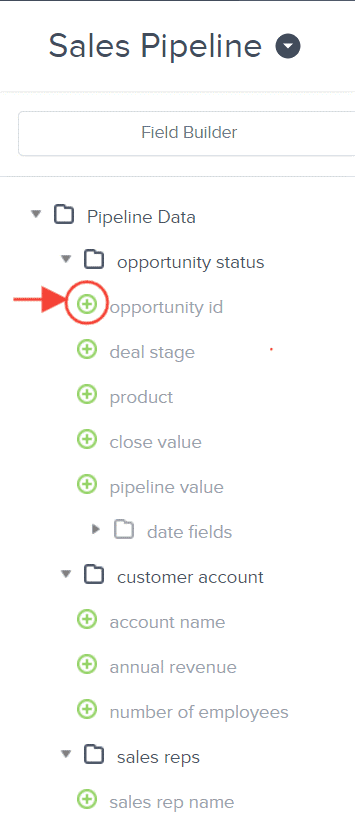
With a report type selected, a report tree will appear. This contains all possible fields for your report.
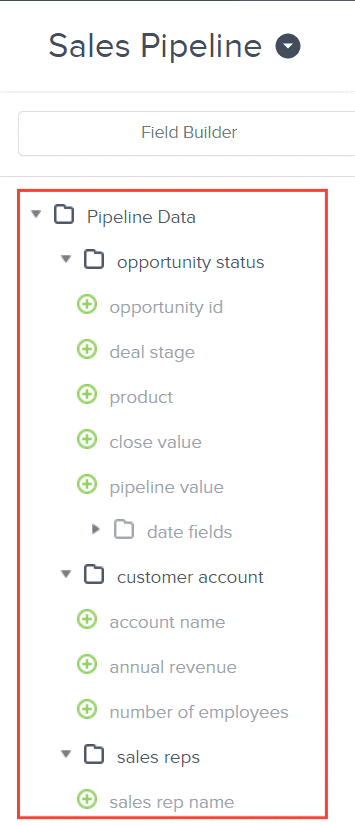
Click the plus icon (+) next to the fields you want to add. These will become the columns in your report and will be reflected in the preview area.
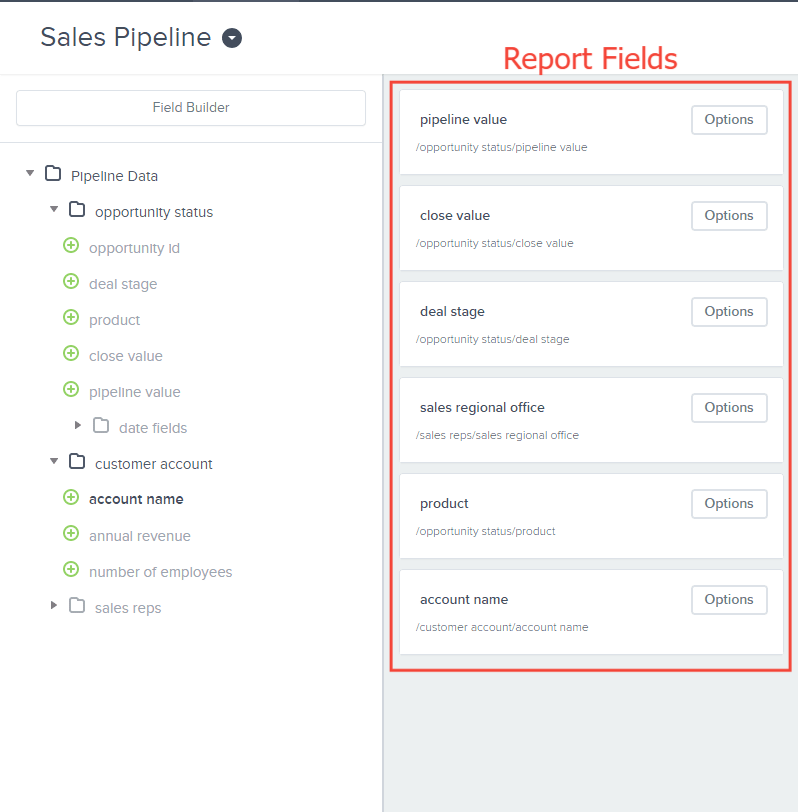
Once you have your selected fields, they will appear in the report fields section.
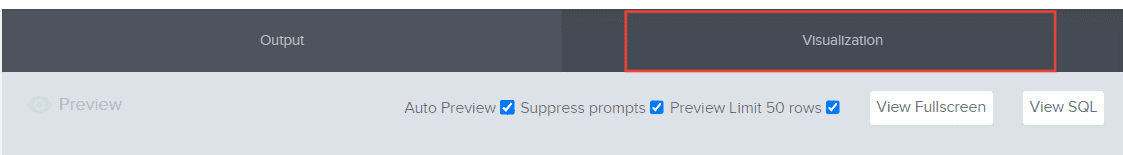
Under Preview Section, click Visualization
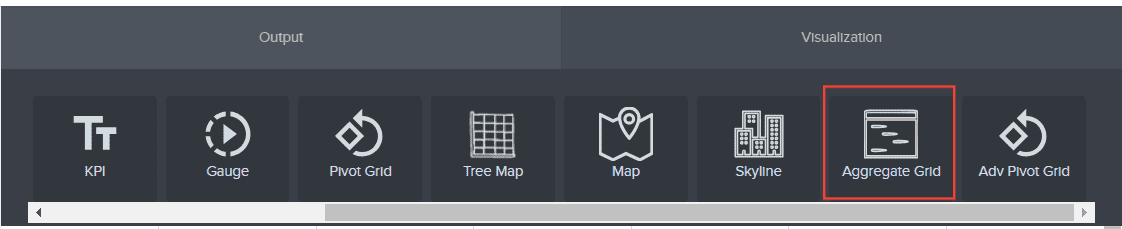
Select Aggregate Grid
Under name drop-down menu, select the value you want to appear on the aggregate grid report. The available value in the drop-down menu is dependent on the report fields selected.
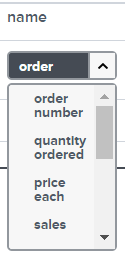
- You can also select Add All to include all the selected fields in the aggregate grid report.

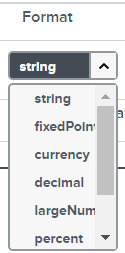
Under format, select the value corresponding to the value selected under name.
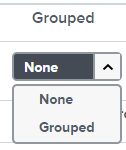
Under Grouped, select None or Grouped. This is useful when you want to group the data by geography, date, or status / stage of a data such as won, lost, or in progress.
Select your Aggregate function
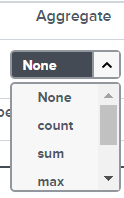
- Count: Counts the instances of how many the data appear in the report. Example would be a sales pipeline where its report field is a deal stage with values in progress, won, and lost under it. This function will count how many in progress, won, and lost you have.
- Sum: Adds all the value of the selected report field. Example would be the select field value is currency. This function will total all the currency you have.
- Max: This function displays the maximum value of the selected field. Example would be the select field value is currency, it will display the highest currency under that field.
- Min: This function displays the minimum value of the selected field. Example would be the select field value is currency, it will display the lowest currency under that field.
- Avg: This function displays the average value of the selected field. Example would be the select field value is currency, it will display the average under that field.
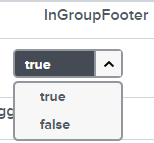
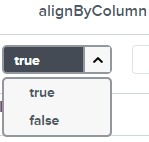
Note: If Aggregate function is none then the In Group Footer and Align by Column will show as NA once it is added, even if they were configured.
Under In Group Footer, select True if you don’t want to display the selected Aggregate function and Grand Total at the end of the report, false if otherwise.
Under Align by Column, select True if you don’t want to display the selected Aggregate function and Grand Total at the within one column, false if otherwise
Type in the Display Format you want in the field box.

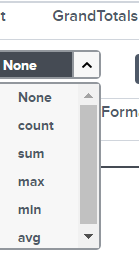
Under Grand Totals, select the function. It is recommended to use the same function you have selected in Aggregate.
Once these are all configured, click Add.

Click Finish

Once done, the configurations you have made will appear in the Preview Section.
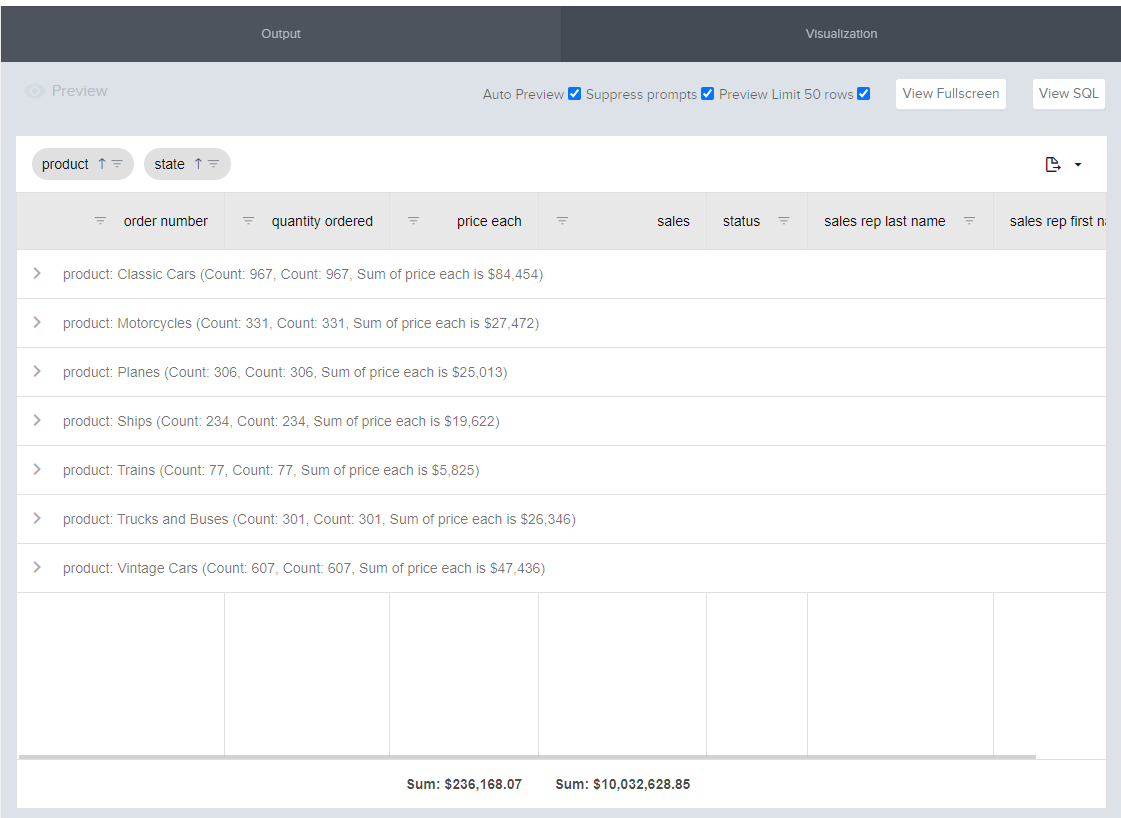
If satisfied, click Save Report.

Type in Report Name and Description.
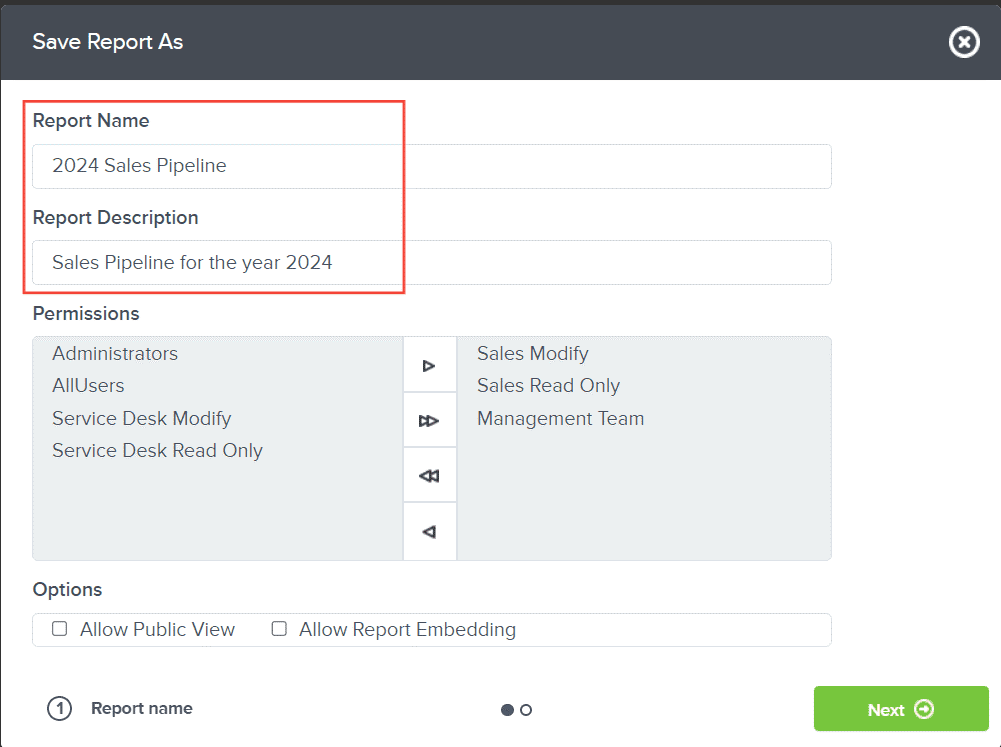
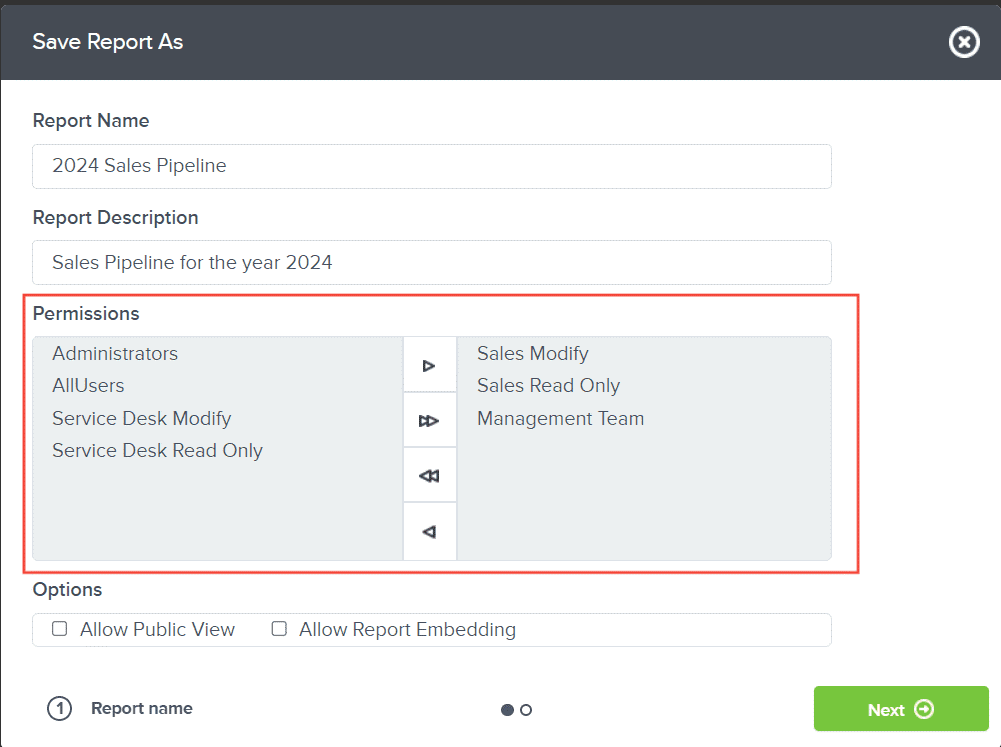
Select the Permission for this report. If no permission is selected, it will inherit the permission of the folder where it will be saved in.
Configure the additional options, as needed.
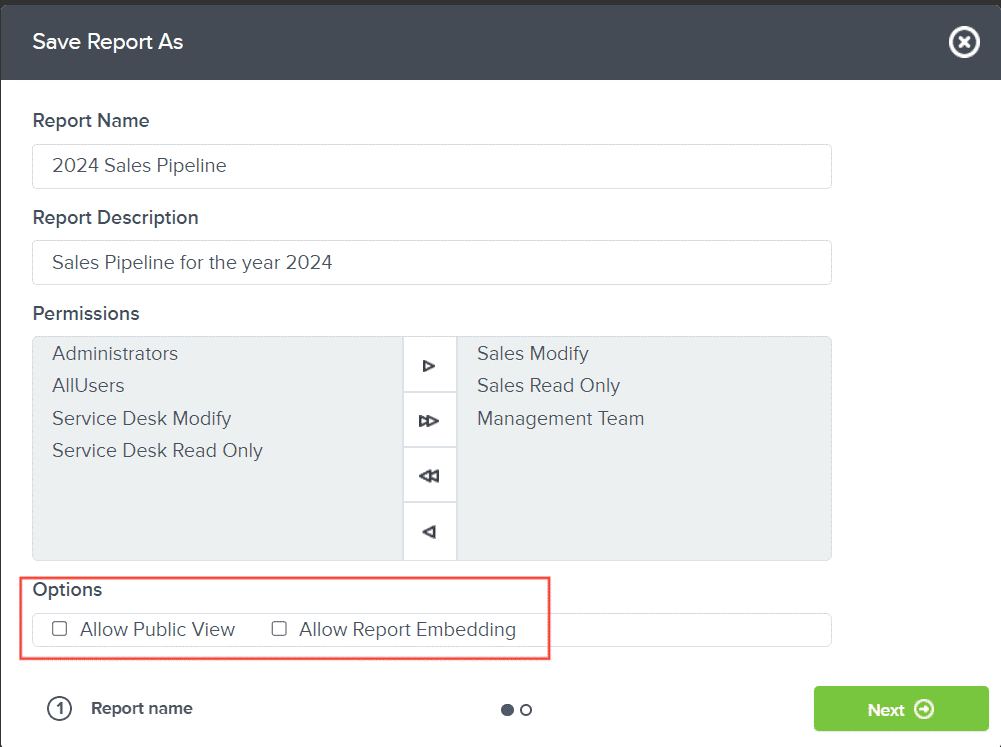
- Allow Public View: Enables non-registered users see the report.
- Allow Report Embedding: Embeds the report into a webpage.
Click Next

Select if you want to save it in your Public or Private Library, then select the folder you want it to be saved in.
Or, create a new folder by clicking Add Folder.

Type in the folder’s name.
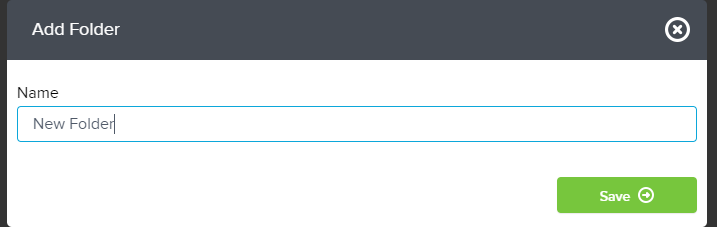
Click Save

Click Finish, after the folder is selected.

And there you have it! You now know how to create an aggregate grid report from scratch!