Version: Yurbi v11
Role: Agent and higher
Permission:  Agent with view permission to the dashboard
A Values Report List helps you customize the values shown in your dropdown list or checkbox list. Instead of relying on the natural output of the data, you can specify what you want to appear.
Let’s dive into the process:
Create a Filter
Here is an article on how to create a filter.
Choose an Operator. The Values Report List will then appear.
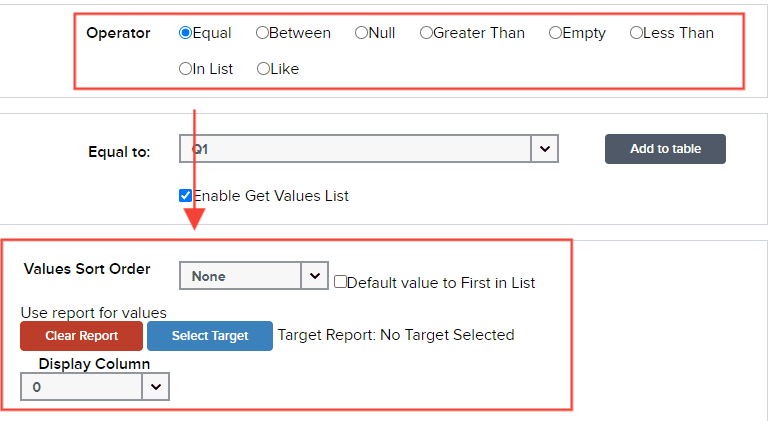
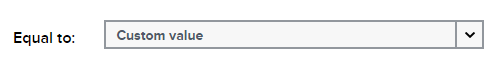
Under Equal to, select Custom Values
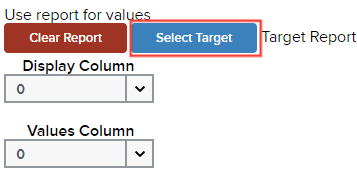
Click on Select Target to choose the report containing your desired data.
Locate the report either from the Public or Private subsection.
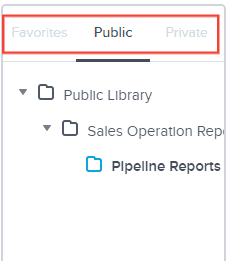
Click on the report once you've found it.
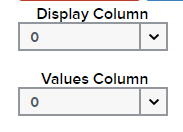
By default, both the Display Column and Values Column are set to 0. Presenting the first column data in the dropdown and as the filter parameter for dashboard widgets.
Click Add to table.
Finally, click Save to store your changes.

And there you have it! Now you know the function of a Values List Report and how you can use this in your dashboards!