Version: Yurbi v11
Role: Builder or higher
Permission: Builder access to the application
Here are the different components in your Preview section and how they work.
Preview Section
On the preview section, you can see the fields you added and configured. By default, it would show a standard output which is a data grid/table report.
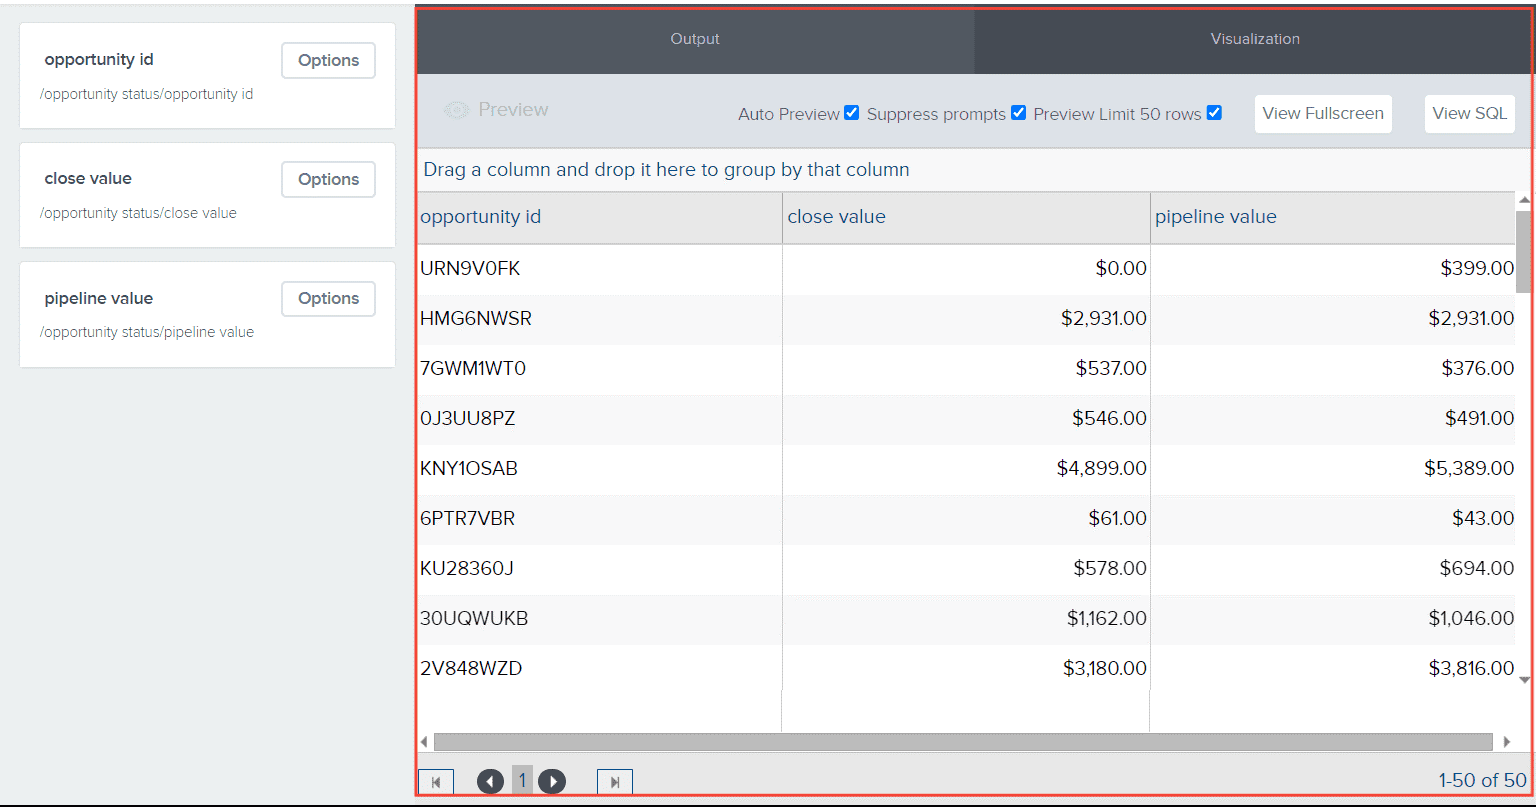
Click on Output to select the report's output format.

These three options are enabled by default in the preview section. Here are their functions:

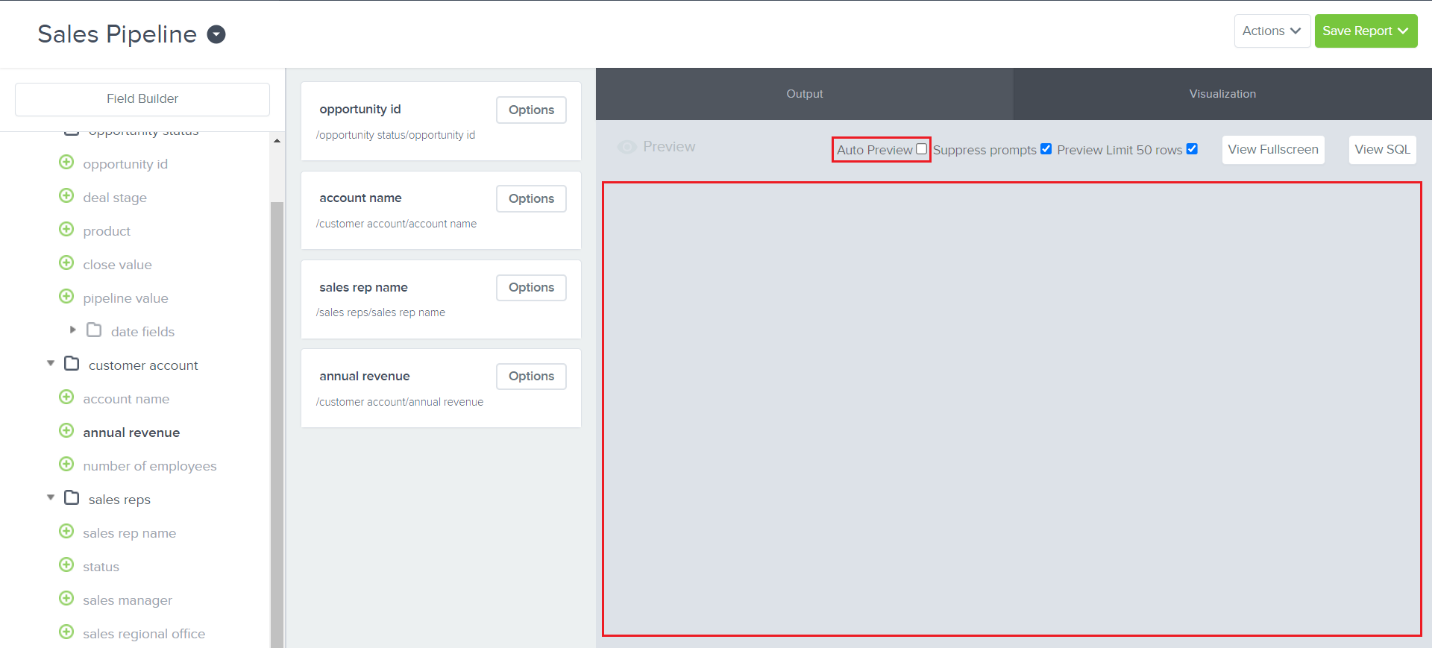
The Auto Preview function is enabled by default, showing changes in real time.
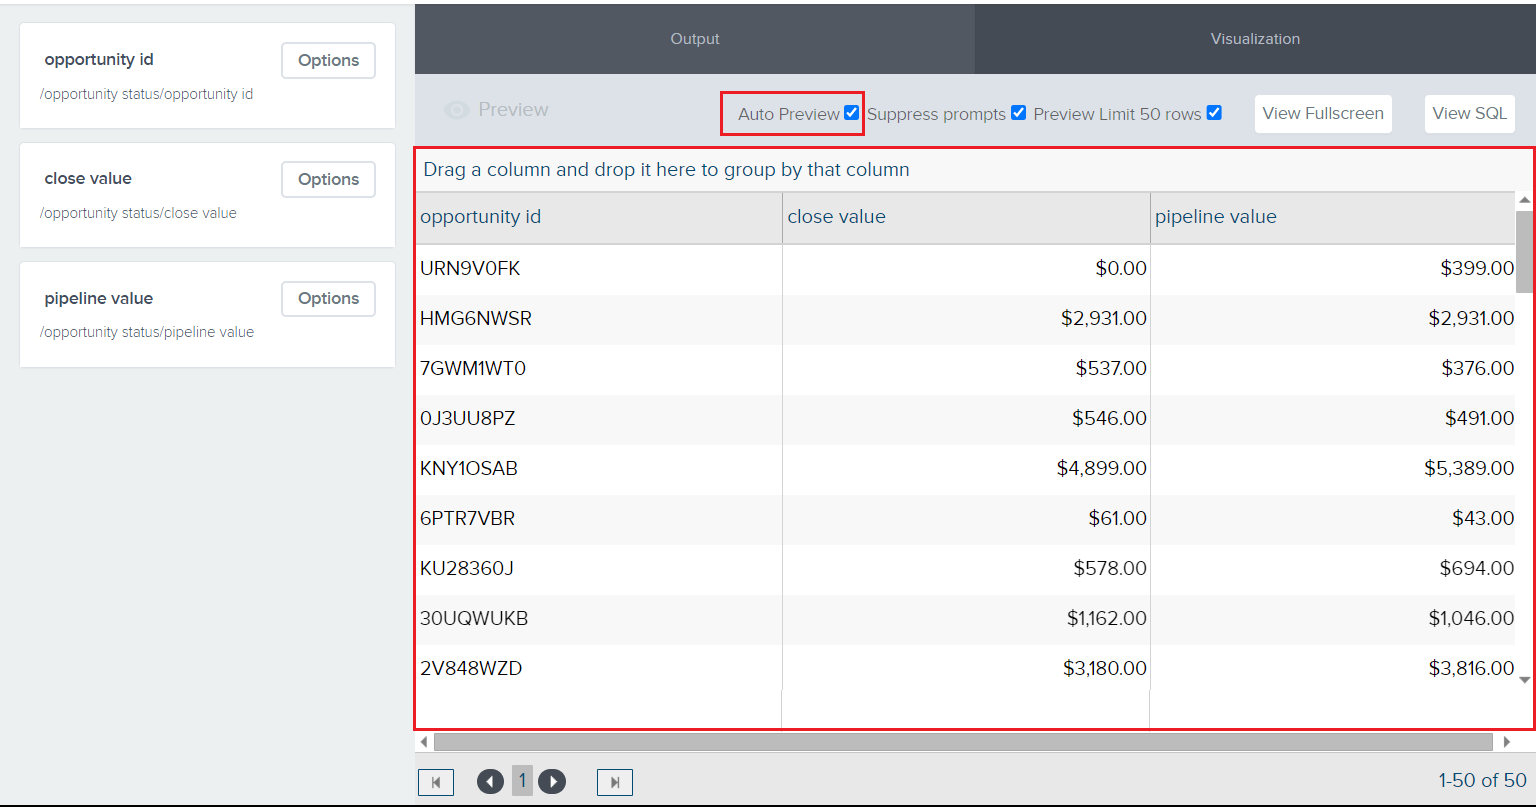
Disabling Auto Preview won’t bring any real time preview of the changes you have made.
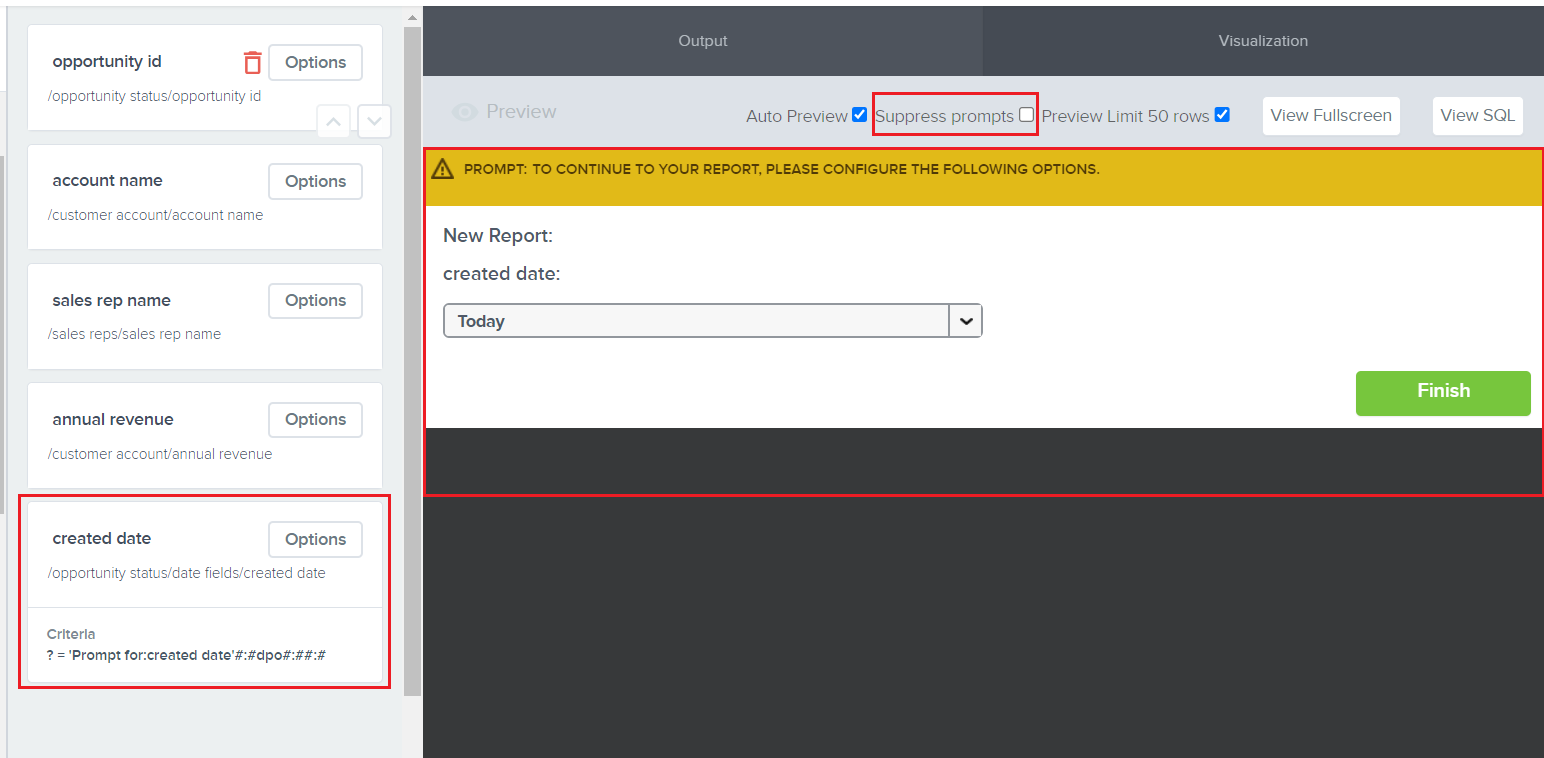
The Suppress Prompts is useful when a field has a prompt for values enabled. It suppresses the prompt in the preview section so that the prompt for values doesn’t keep appearing.
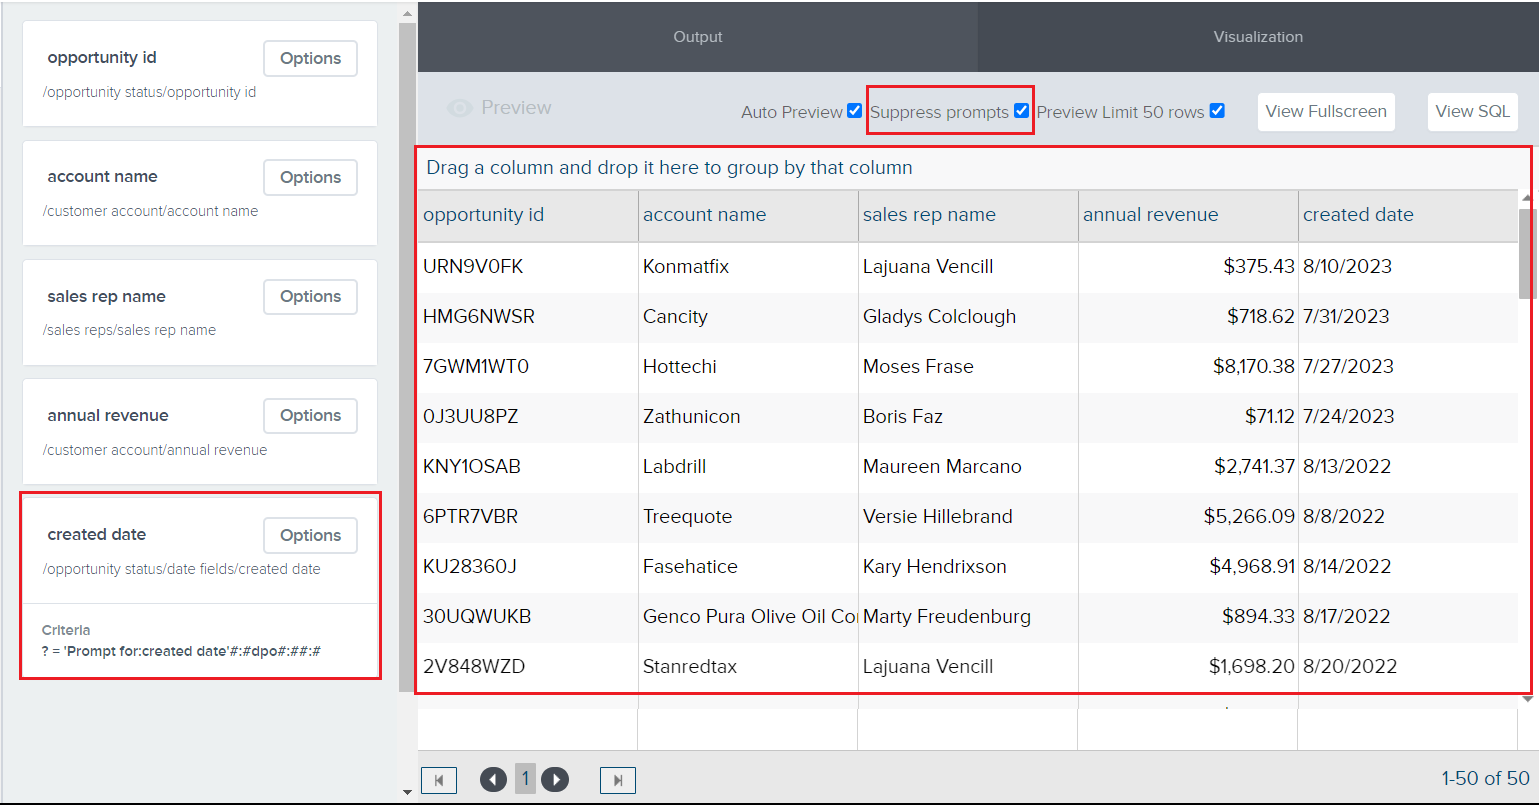
Disabling Suppress Prompts means that the prompt value will appear in the preview section, and you have to configure that prompt to be able to proceed with the preview of the report you are building. It will also appear when you click View Fullscreen.
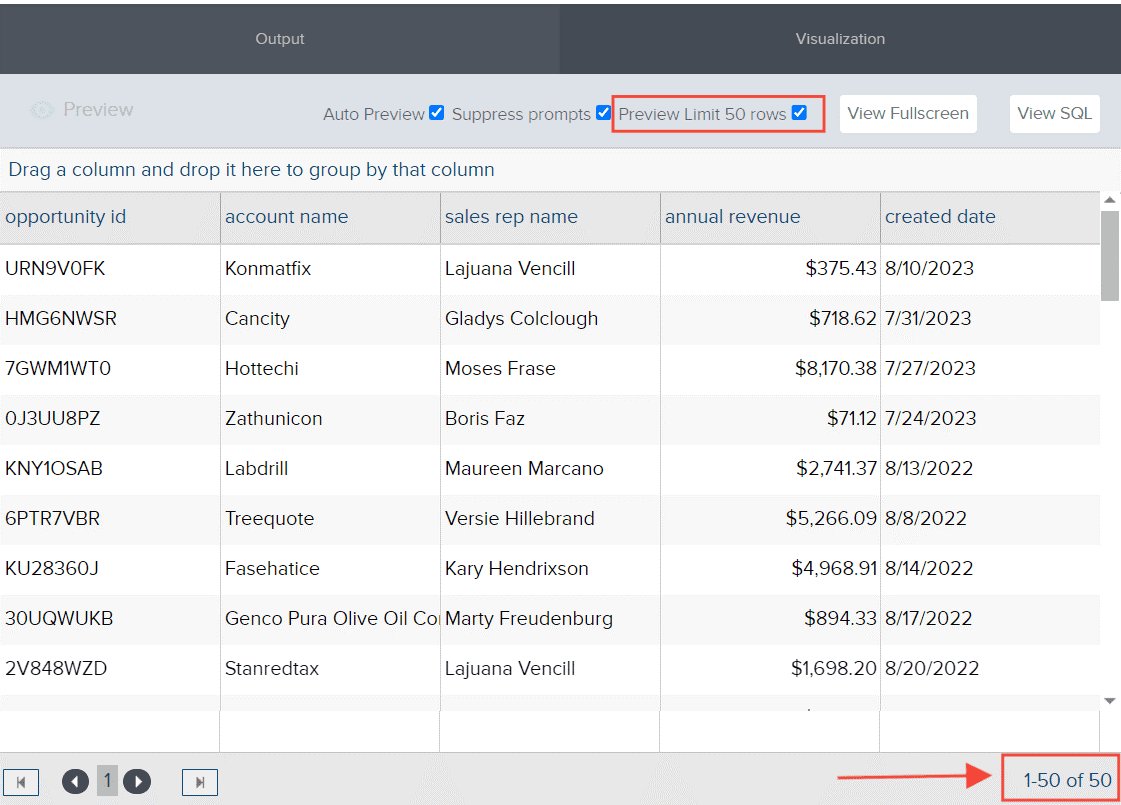
The Preview Limit 50 rows feature is set by default to load only 50 records at once, protecting the database from heavy queries.
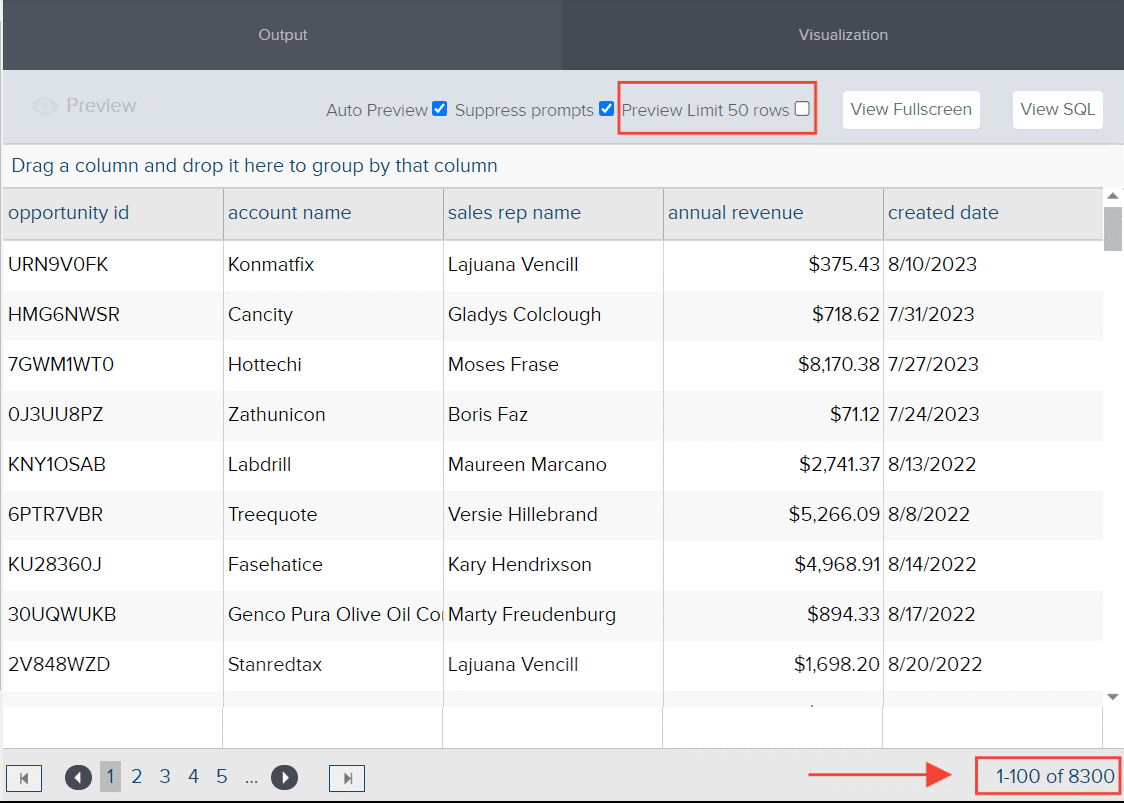
Disabling Preview Limit 50 rows will bring you all the queries related to the report you are building.
Clicking the Preview Button refreshes the preview section.

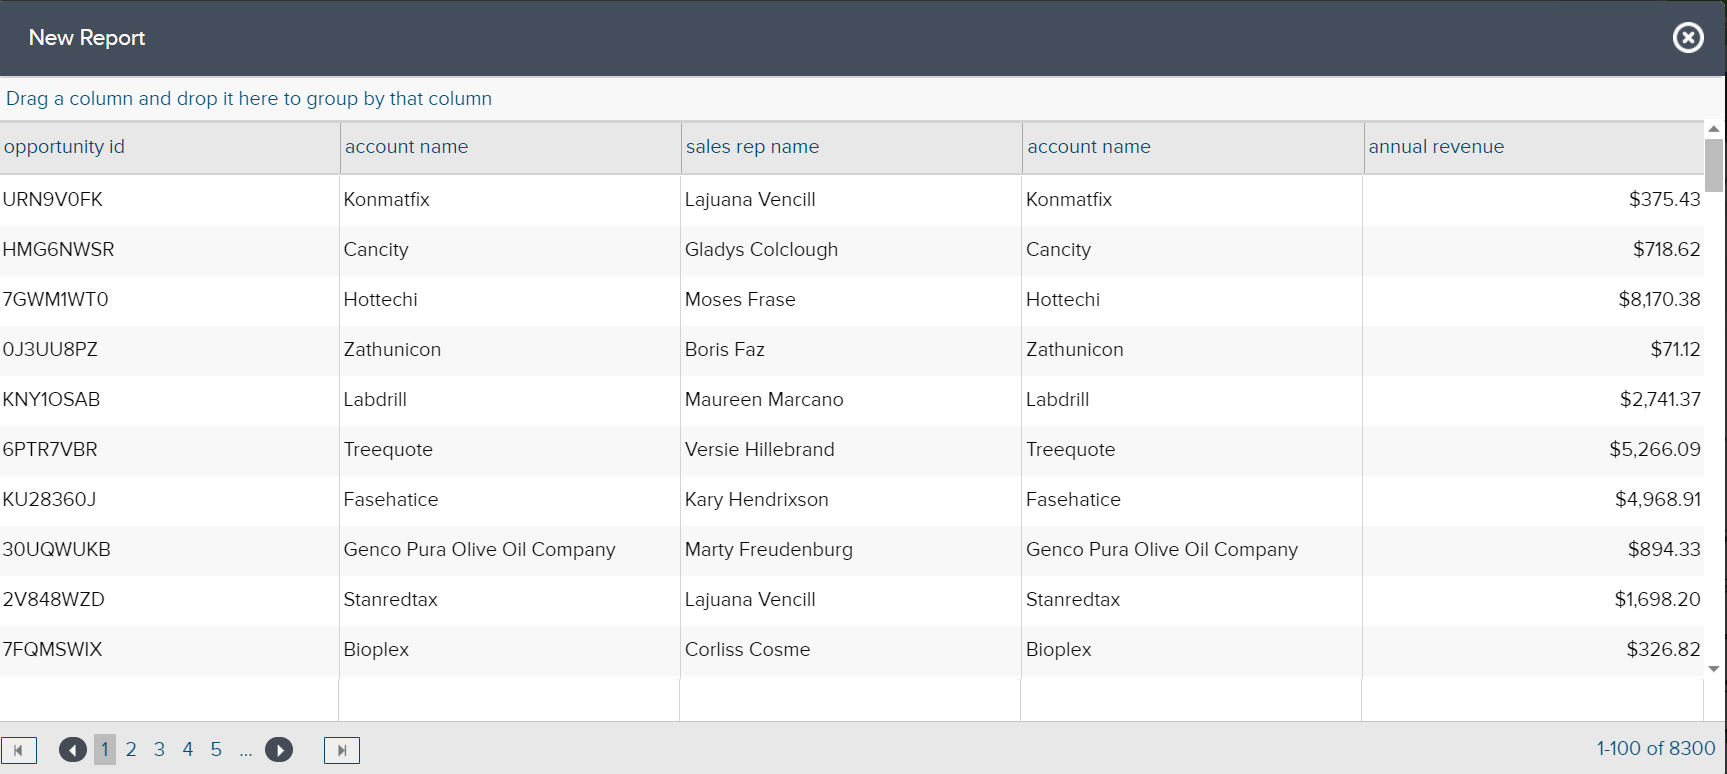
Clicking View Fullscreen gives you a full preview of the report that you are building via a pop-up box.

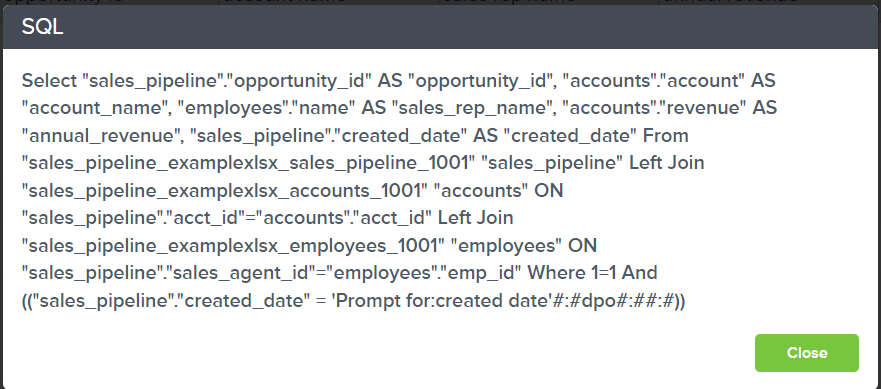
Clicking View SQL will display the commands used to retrieve data from a database for the report.

Additional Settings and their Uses
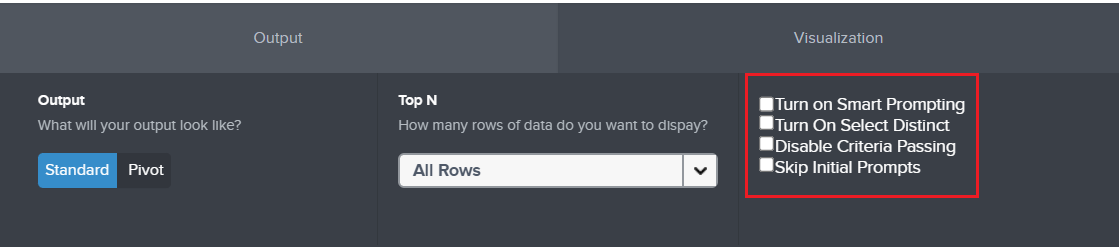
- Turn on Smart Prompting: This feature connects numerous independent enabled Prompt for Values of a fields report, similar to the Smart Filters functionality in a dashboard. After you set up the first prompt, following prompts will automatically refine their choices based on the selection made in the first prompt, creating a more integrated and intuitive filtering process. Once set, you can configure the prompt using the prompt panel without adhering to the sequence.
- Turn on Select Distinct: This option filters out duplicate entries within a field, ensuring that only unique data is displayed.
- Disable Criteria Passing: The checkbox is ticked off when creating an advanced report.
- Skip Initial Prompts: This setting permits users to bypass the default sequence of an active Prompt for Values of a field report. It presents a prompt panel where users can choose any prompt without following the set order. It is important to note that enabling this feature will disable Smart Prompting.
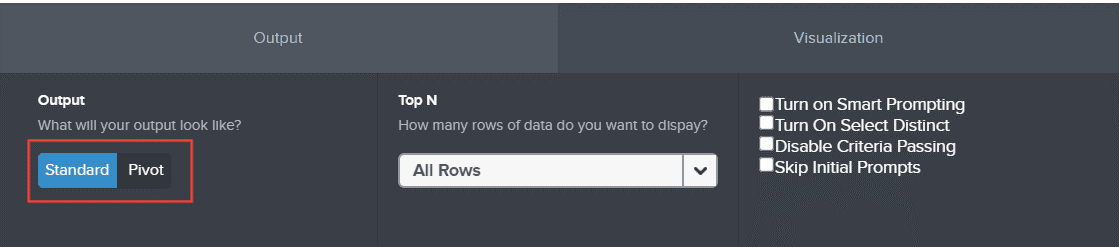
Accessing Output and Visualization
To access Output, simply click Output

Under Output there are two options. Standard and Pivot. Choose Standard for a regular report, which is a data grid or table, or Pivot for a pivot table analysis.
Here is an article on creating a pivot table analysis.
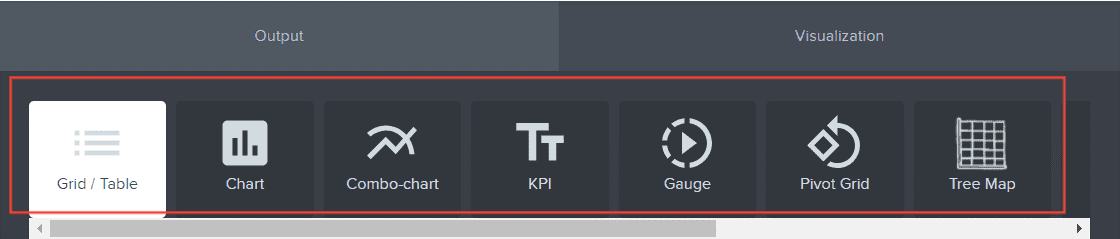
For visual outputs like graphs or maps, click Visualization option.

And there you have it! You now know the different options available in your preview section and how they affect the report you're building!