Preview Section Explained
Version: Yurbi v12
Role: Builder or higher
Permission: Builder access to the application
Overview
Here are the different components in your Preview section and how they work.
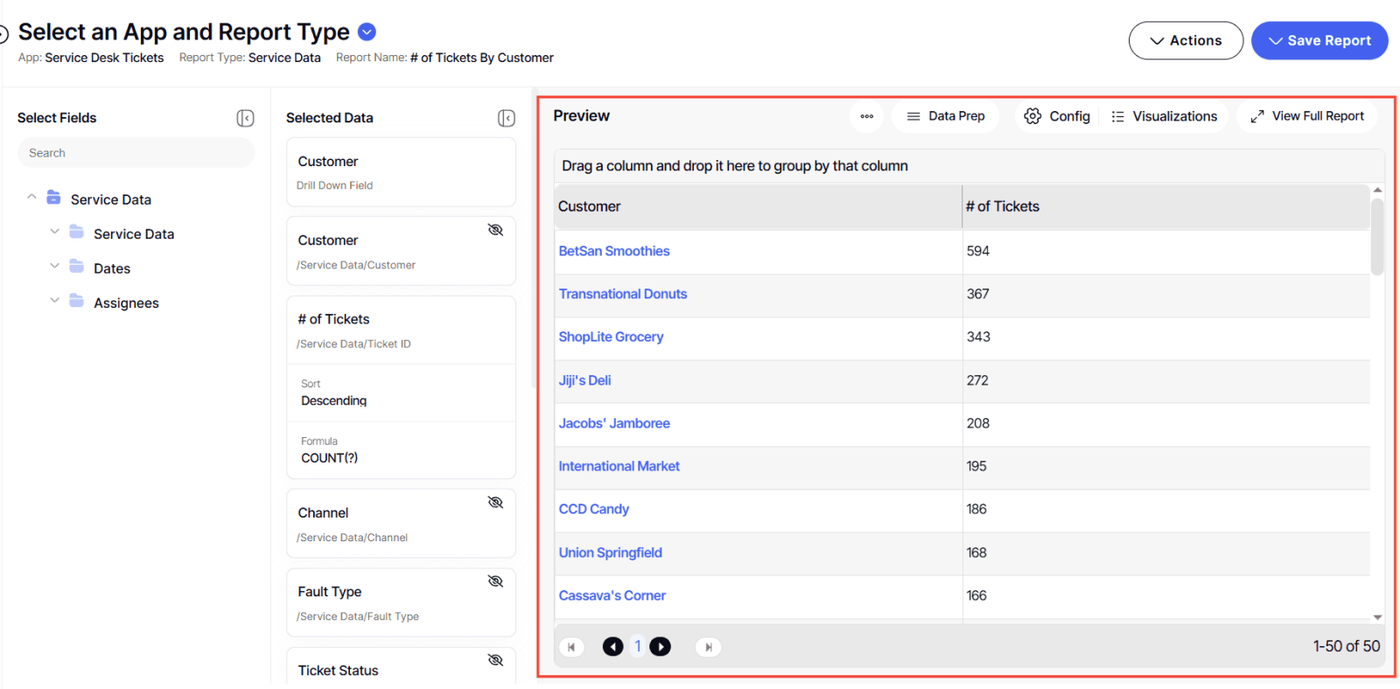
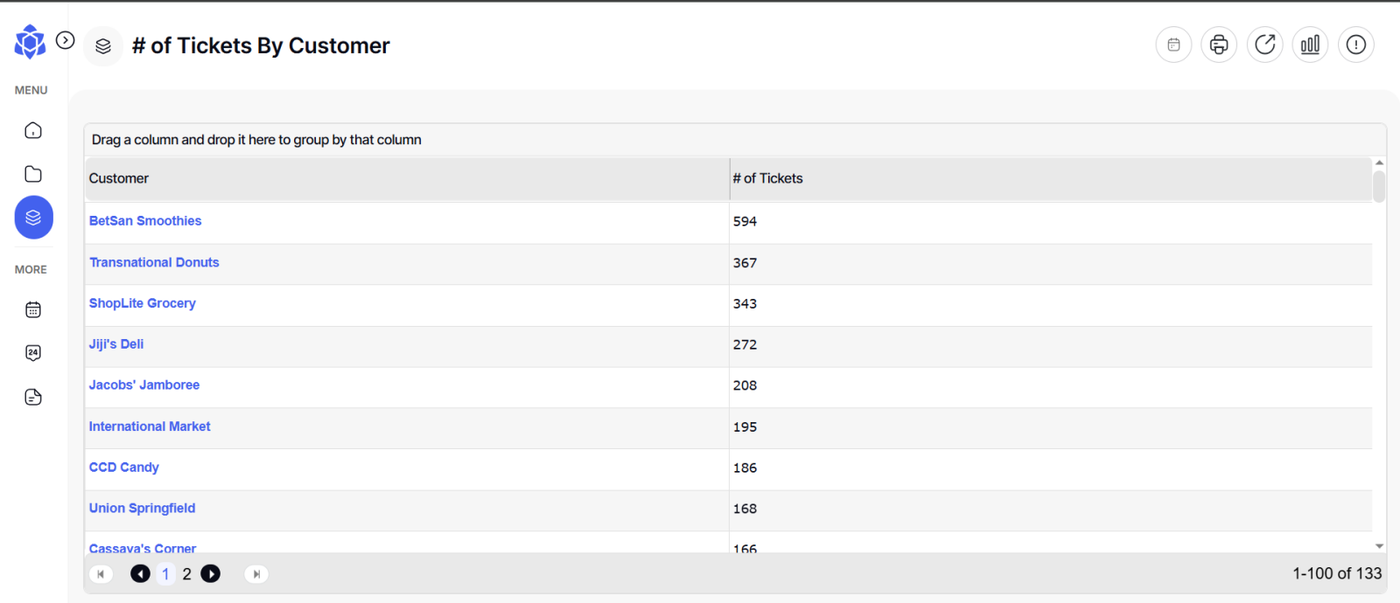
Preview Section
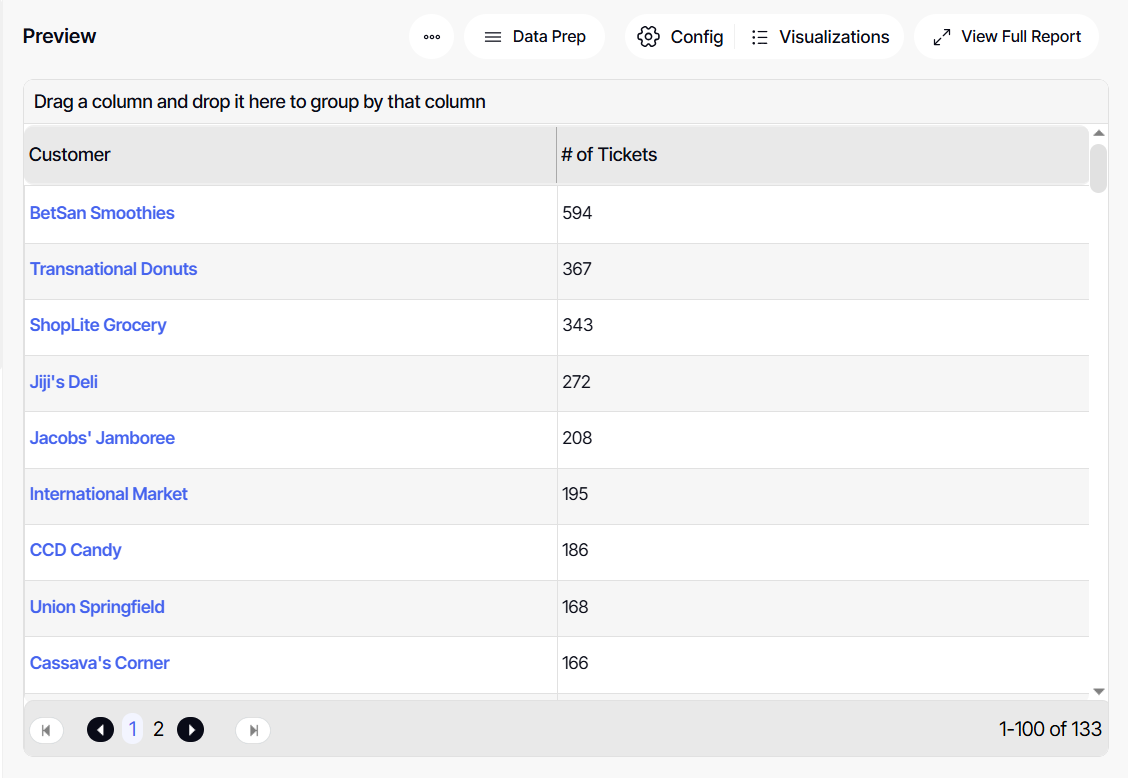
On the preview section, you can see the fields you added and configured. By default, it would show a standard output which is a data grid/table report.
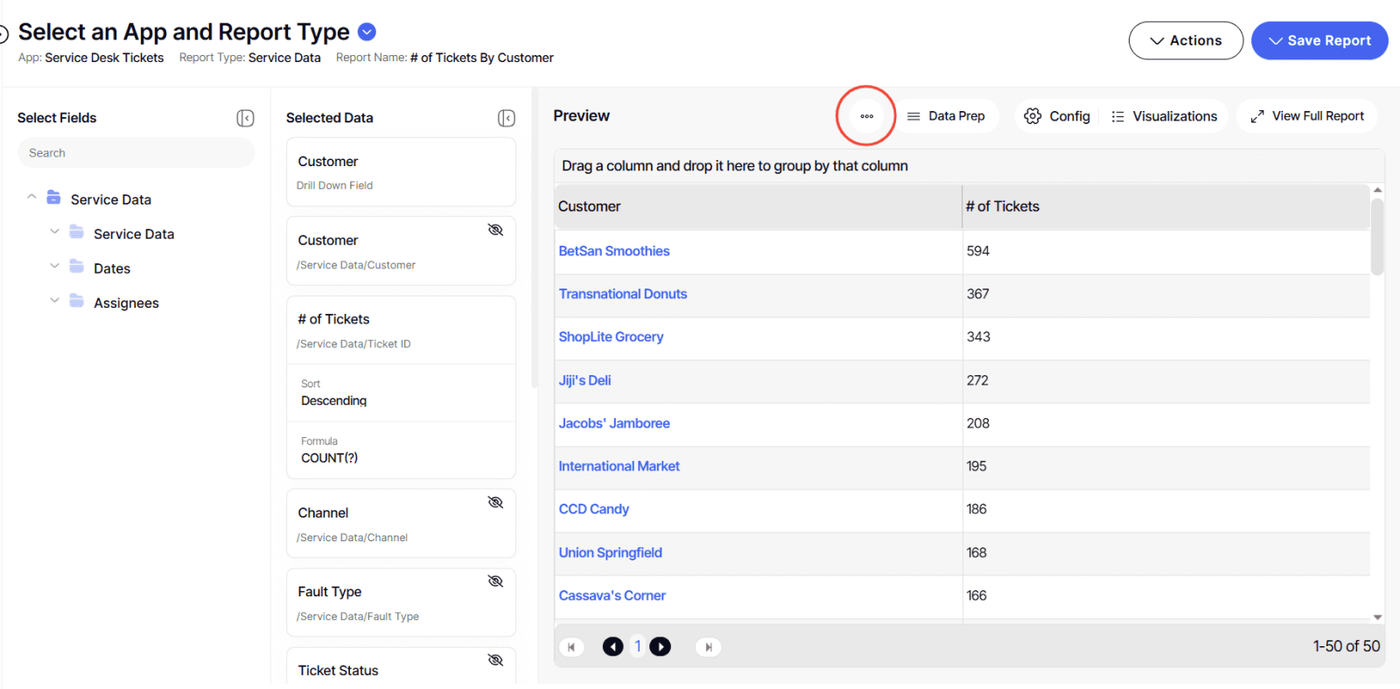
Three Dots Button
1. Under the three dots button, the user will find the following options.
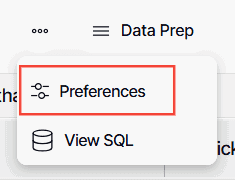
Preference
1. Click Preferences to access the following options:
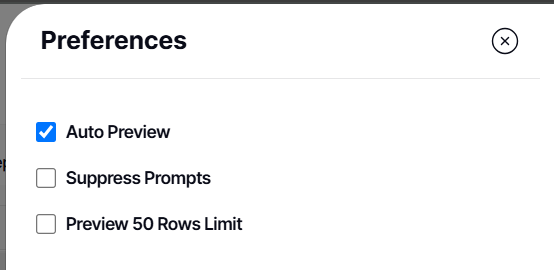
Auto Preview
1. This function is enabled by default, showing changes in real time.
![]()
2. Disabling Auto Preview won’t bring any real time preview of the changes you have made.
![]()
Suppress Prompts
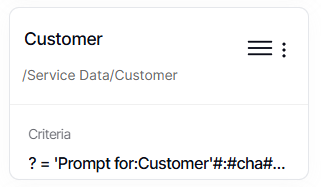
This is useful when a field has a prompt for values enabled. It suppresses the prompt in the preview section so that the prompt for values doesn’t keep appearing.
1. Click Suppress Prompts to activate
![]()
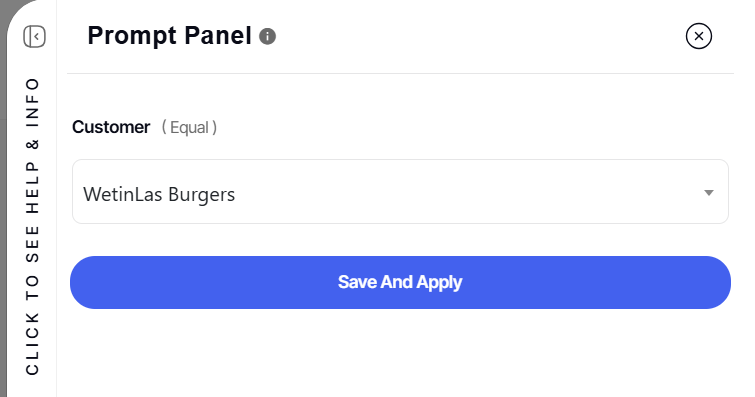
2. Disabling Suppress Prompts means that the prompt value will appear in the preview section, and you have to configure that prompt to be able to proceed with the preview of the report you are building. It will also appear when you click View Fullscreen.
![]()
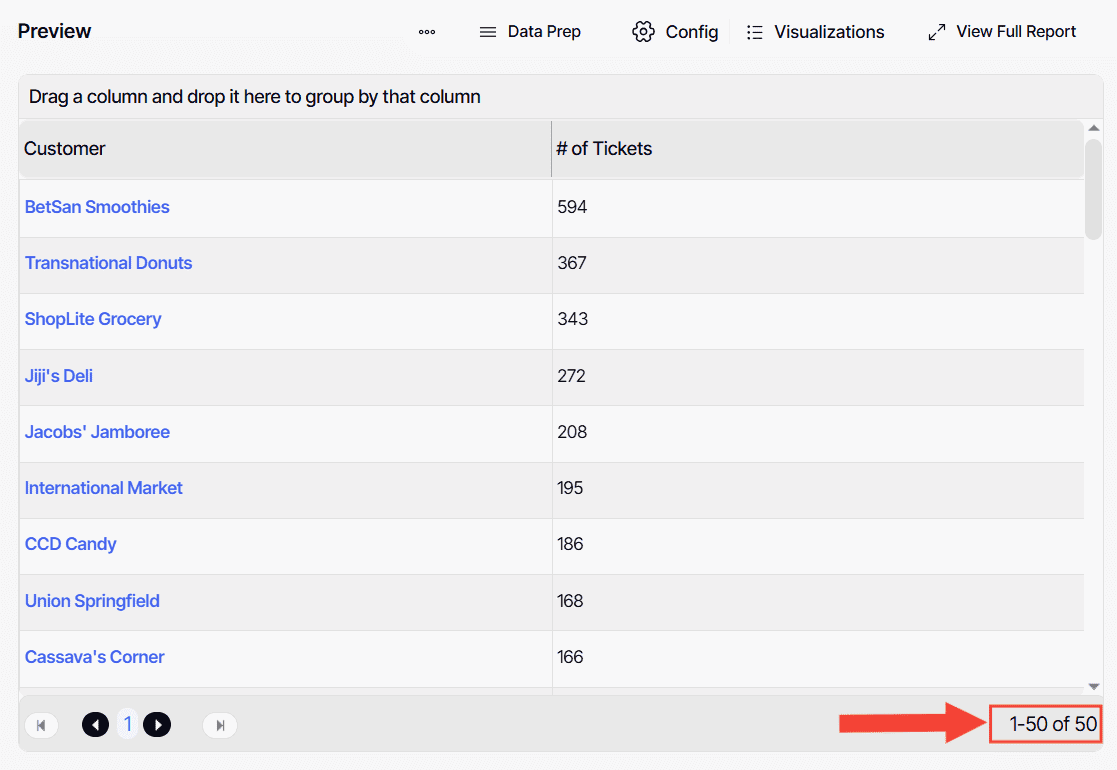
Preview 50 Rows Limit
This feature is set by default to load only 50 records at once, protecting the database from heavy queries.
![]()
Disabling Preview 50 Rows Limit will bring you all the queries related to the report you are building.

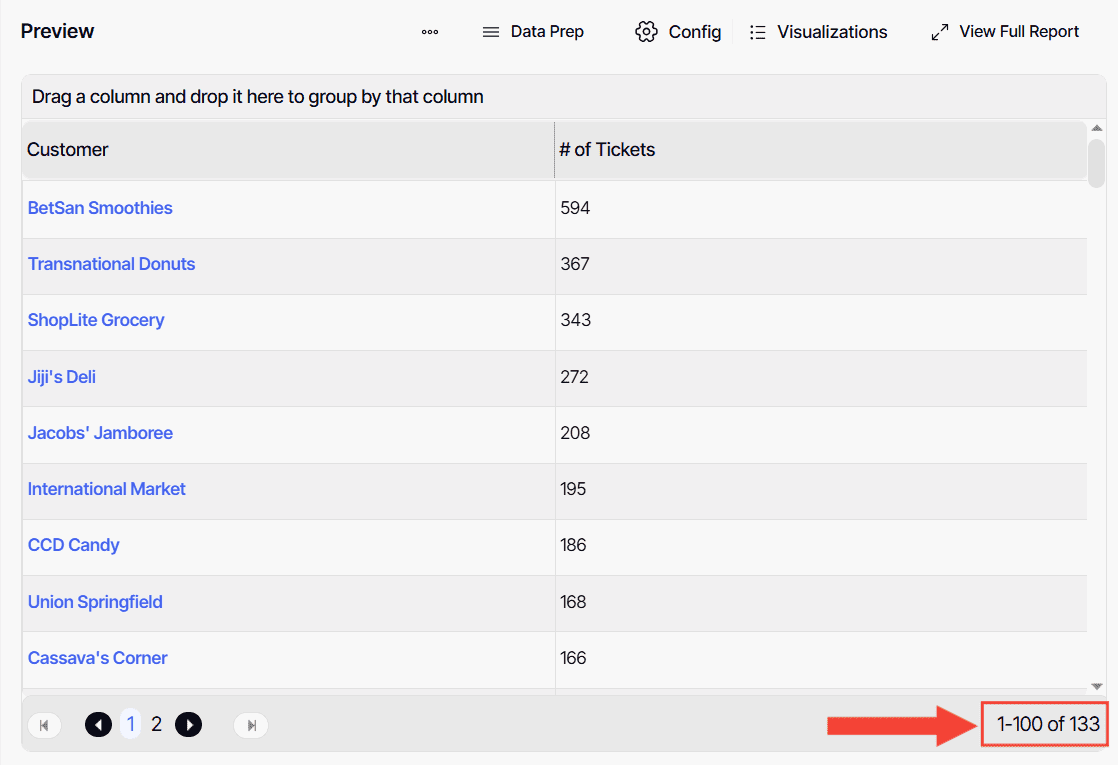
1. After any changes made, click Save & Apply

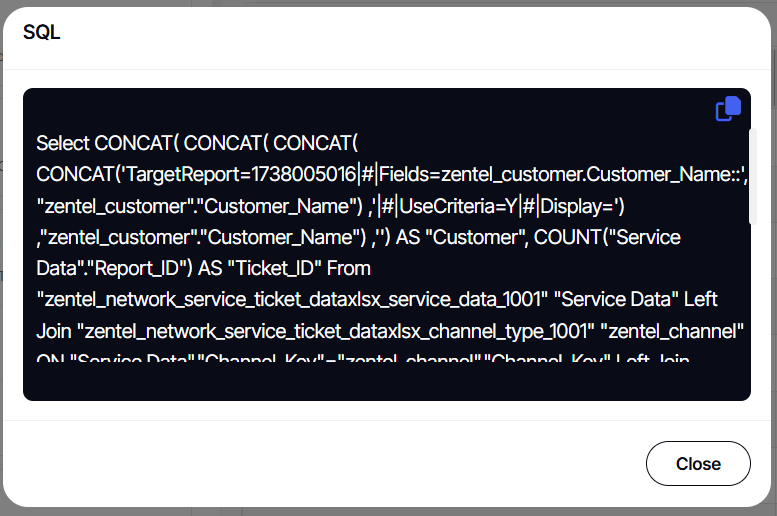
View SQL
1. Clicking View SQL will display the commands used to retrieve data from a database for the report.
Data Prep
Under Data Prep has the following options:
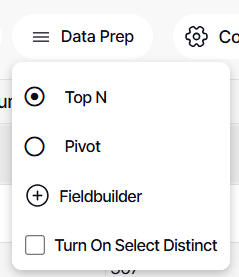
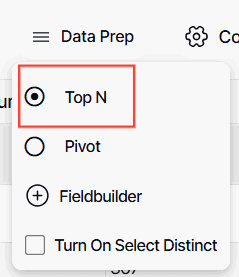
Top N
This option enables the user to select how many rows of data their standard report they want to display from a drop-down menu.
1. Click Top N option
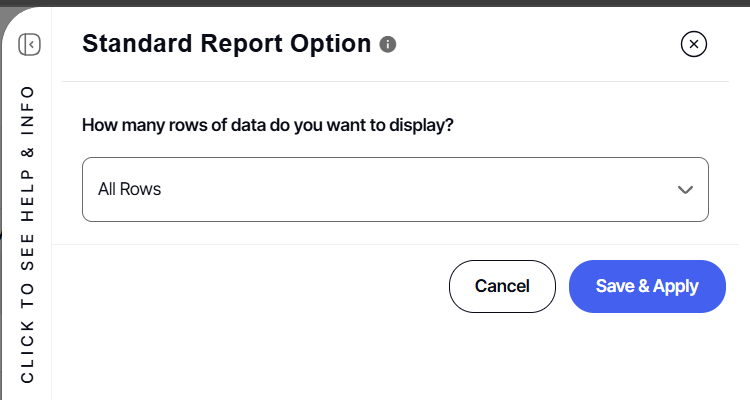
2. Select how many rows of data you want to be displayed
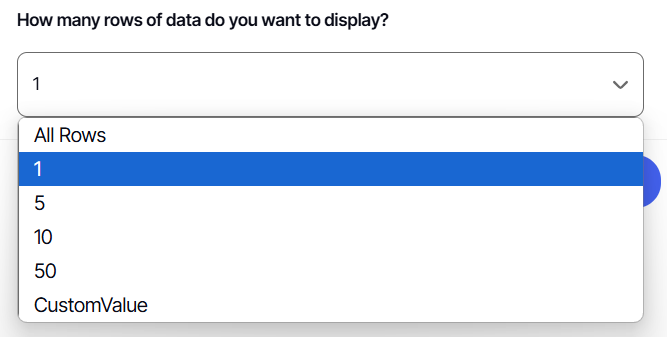
3. Click Save & Apply

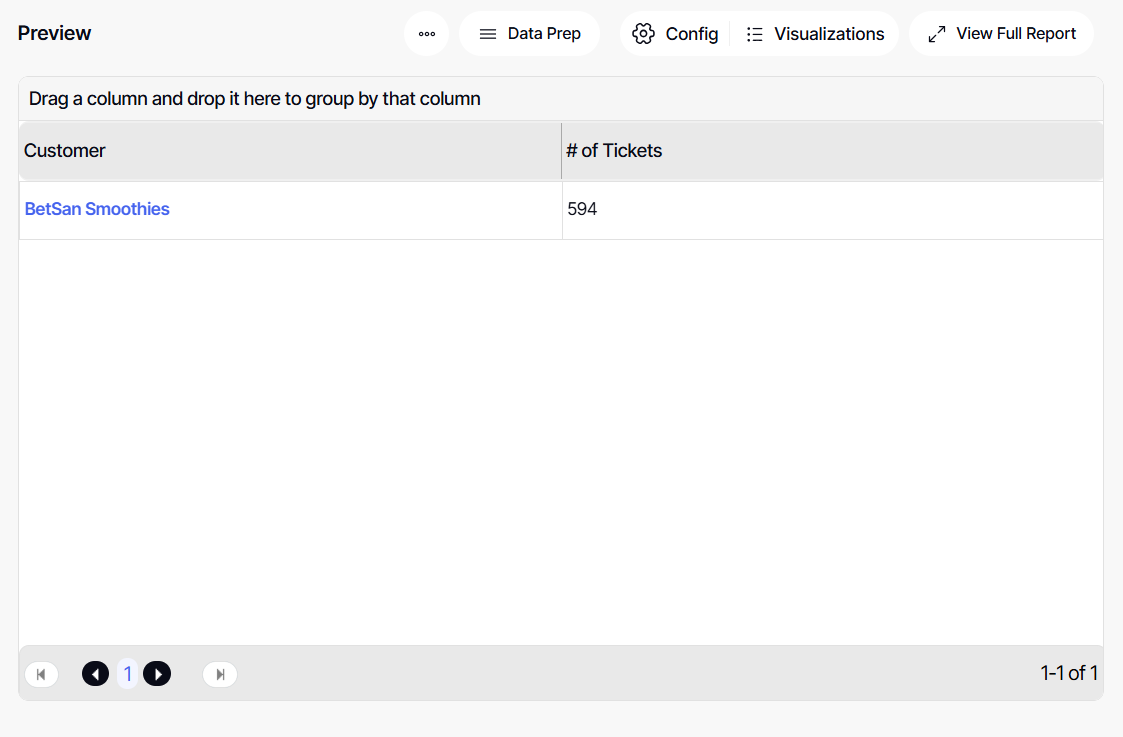
This is how it will look in the preview section
Pivot
This option gives the user the choice to make a pivot table analysis
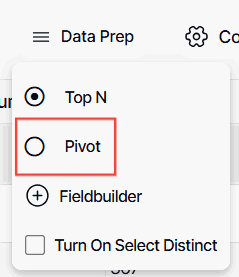
Here is an article on creating a pivot table analysis.
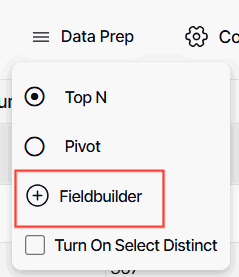
Fieldbuilder
1. Click Fieldbuilder
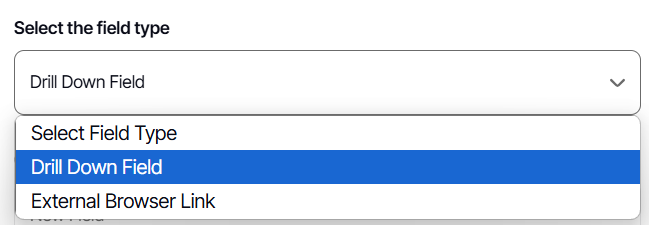
2. Select Field Type
3. Type in Column Header
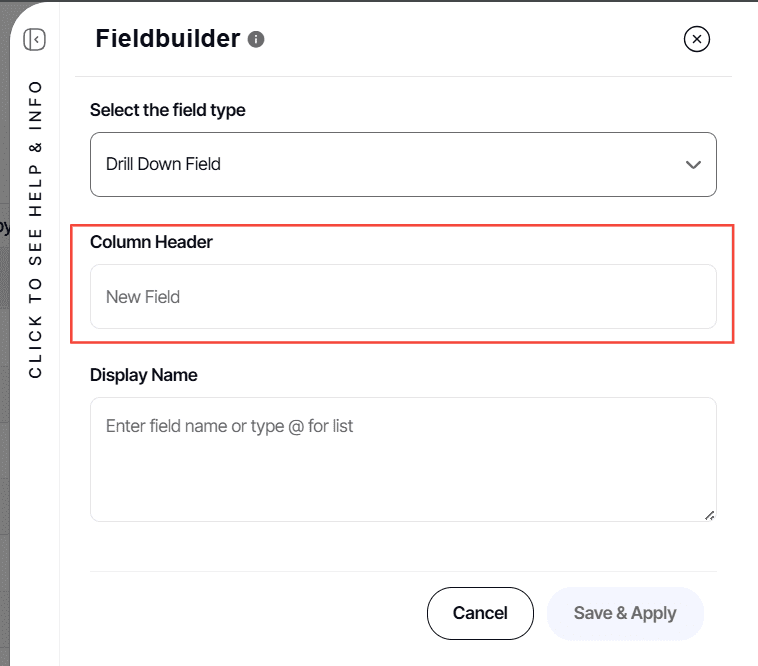
4. Enter a Display Name
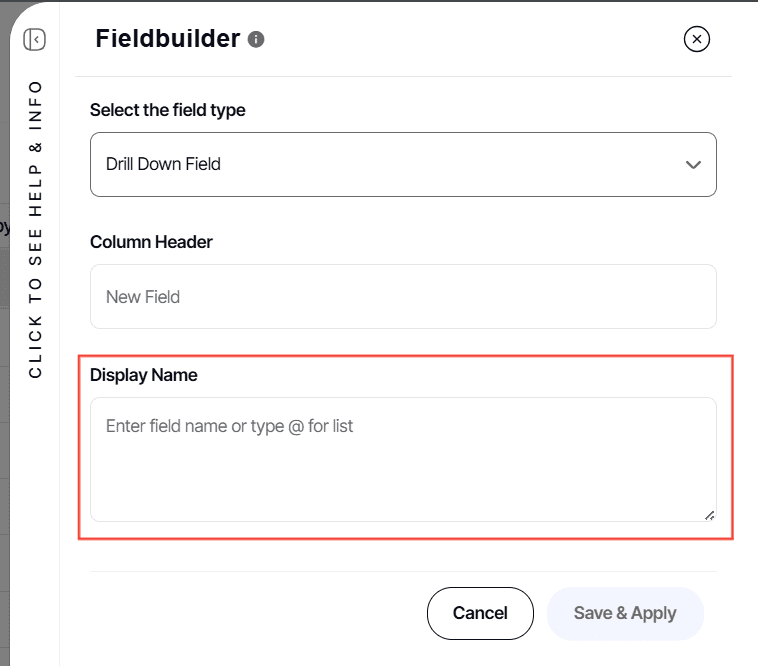
5. Click Save & Apply

Turn on Select Distinct
This option filters out duplicate entries within a field, ensuring that only unique data is displayed.
1. Simply tick off this option to activate it

Config
This option has the following actions:
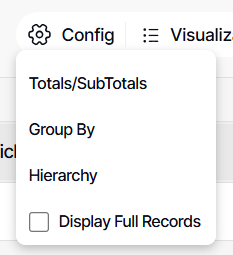
Totals/SubTotals
This option gives the user the choice to totals/subtotals report fields.
Group By
This option allows the report be grouped under one of the report fields
Hierarchy
This allows the report fields be under one big column or group, depending of the configuration of the user.
After any changes made, click Save & Apply.

Display Full Records
This makes the report to display the data in one page or sheet.

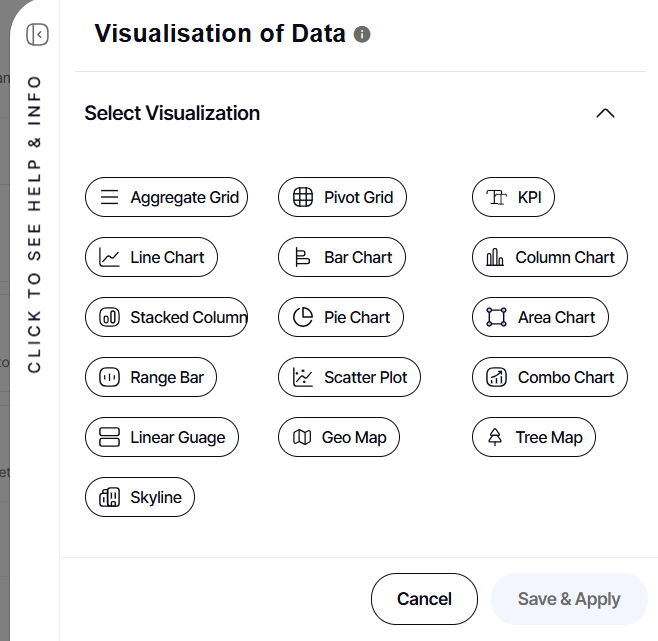
Visualizations
This section houses the different visualization reports that Yurbi has.
1. For visual outputs like graphs or maps, click Visualization option.
![]()
View Full Report
This option gives the user to view the report in a full screen manner not just within the preview section.
1. Click View Full Report button

It will redirect the user to the full report.
And there you have it! You now know the different options available in your preview section and how they affect the report you're building!