How to create a new pivot table analysis report
Version: Yurbi v12
Role: Builder or higher
Permission: Builder access to the application
Overview
In this guide, you will learn how to create a new pivot table analysis report from scratch in builder. We will talk about the process and the different options to configure when creating and editing a new pivot table analysis report. We will also cover how to create a pivot table analysis with a drill-down report.
Accessing the Builder Section
This section shows the step on how you can access the builder section
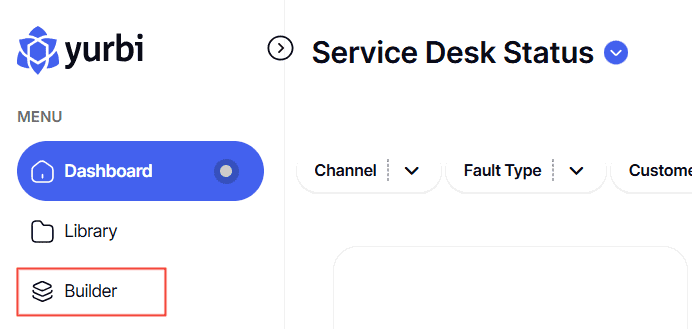
1. Once logged in, click Builder option found at the left side bar.
Creating Aggregate Grid Report
This section shows the steps on how you can create your aggregate grid report
Select Application and Report Type
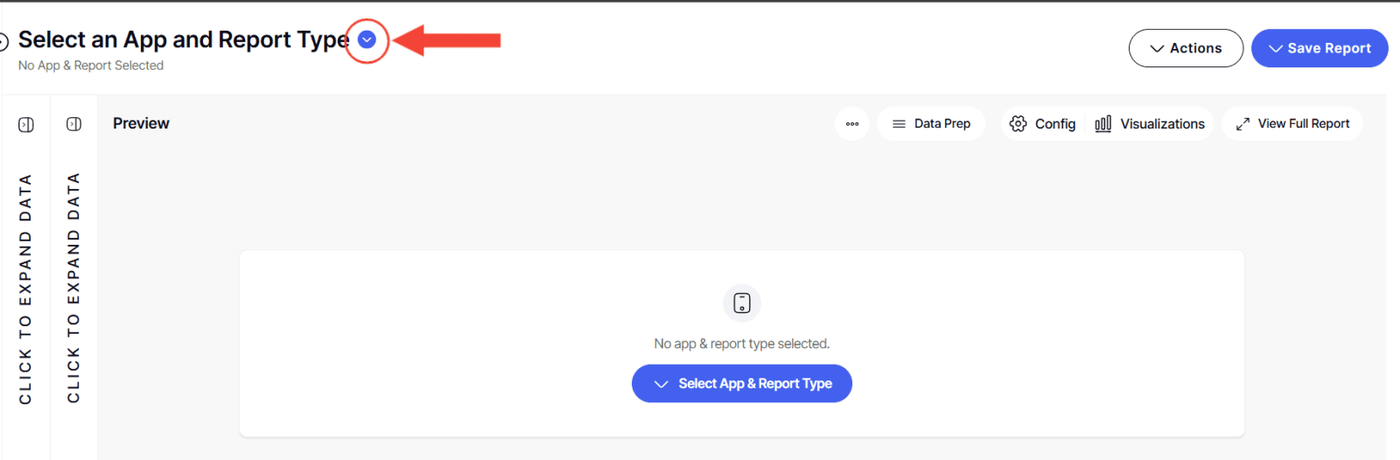
1. Click the down arrow next to Select an App and Report Type to open the dropdown menu.
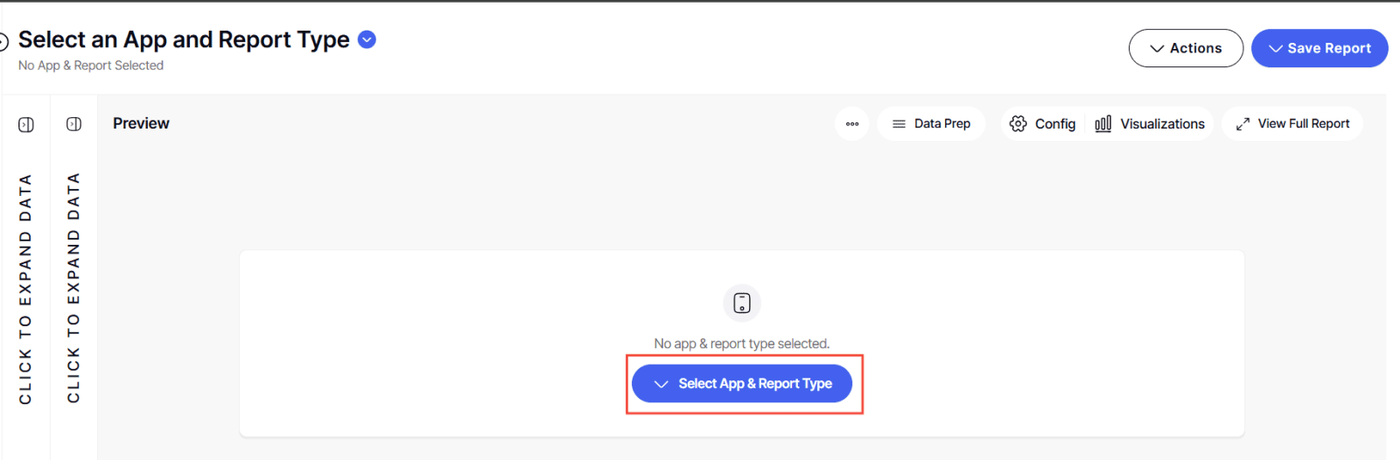
Or, Click the Select an App and Report Type button found in the middle of the interface
2. Choose the application you wish to build a report for. The options are the applications you are authorized to modify.
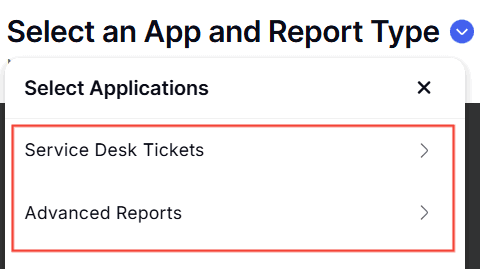
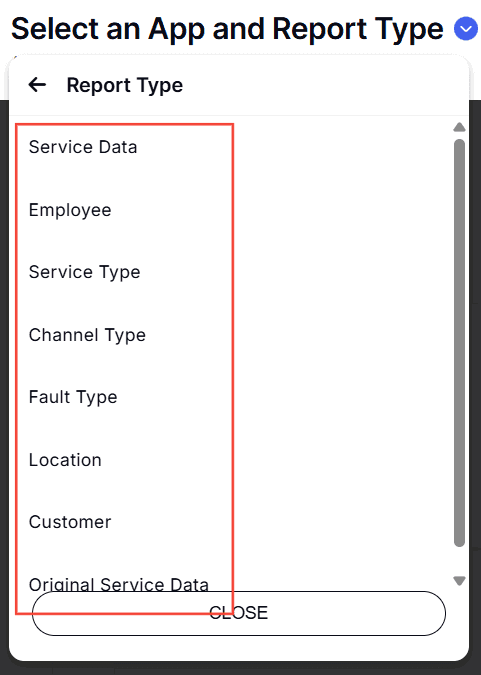
3. Now, pick the type of report you intend to create. Depending on the application, different report types will be available for your selection.
Building Your Report
This section covers the step by step of building your report starting with selecting your desired report fields to configuring the pivot table report.
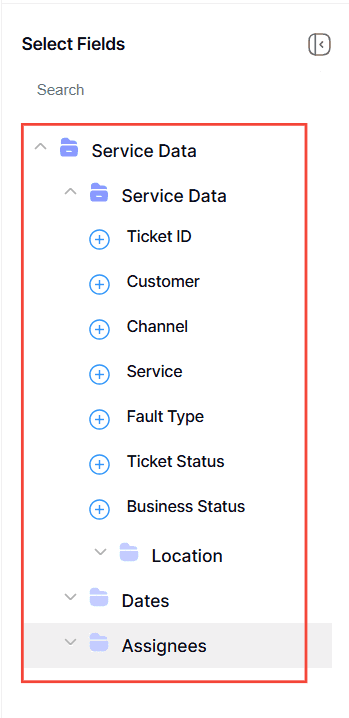
1. With a report type selected, a report tree will appear. This contains all possible fields for your report.
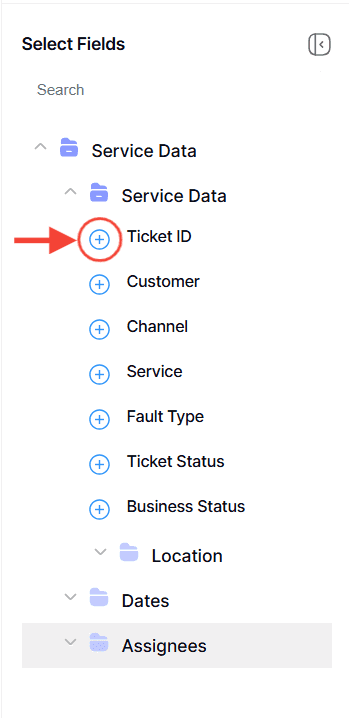
2. Click the plus icon (+) next to the fields you want to add. These will become the columns in your report and will be reflected in the preview area.
For more in depth process, here is an article on how to create a new data grid report from scratch.
Configuring Your Report
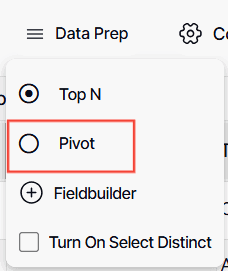
1. Click Data Prep
2. Select Pivot
Note: Available field for selection will be dependent on the report fields you’ve added.
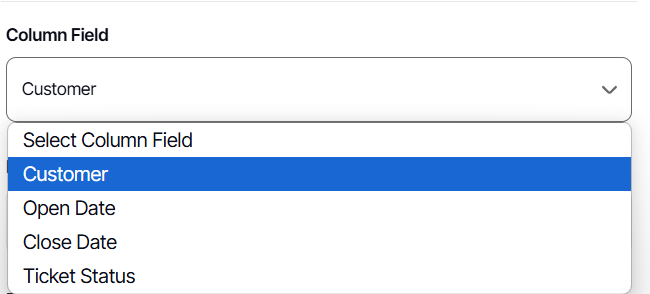
3. Select a Column Field from the drop-down menu
A column field is selected from a dropdown to define the specific data column that will be used in the pivot report options. This selection determines how the data will be organized and analyzed in the report.
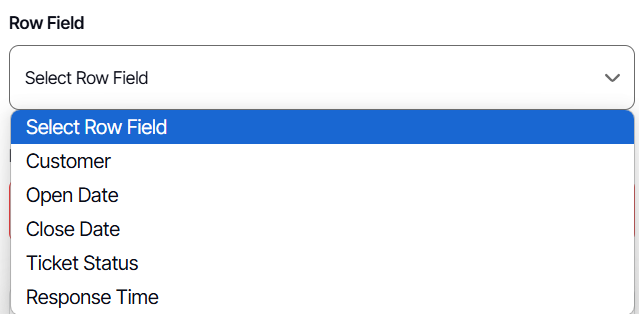
4. Select a Row Field from the drop-down menu
A row field is selected from a dropdown to specify the data column that will be used in the rows of the pivot report. This selection influences how the data is categorized and displayed in the report layout.
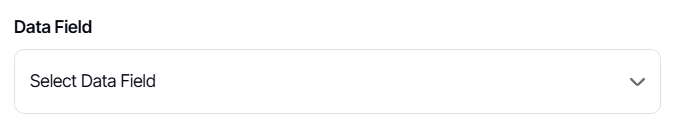
5. Select a Display Field from the drop-down menu
A data field is selected from a dropdown to define the specific data column that will be utilized in the pivot report. This selection determines the values that will be analyzed and presented in the report.
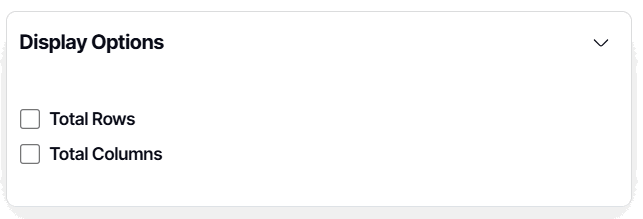
6. Click Display Options
Display options are provided through checkboxes to determine whether total rows or total columns should be included in the report. This allows for customization of the report's presentation based on user preferences.

7. Tick off Total Rows and Total Columns to show the total value of the data field selected in a column and row.
8. Click Save & Apply

And there you have it! You now know how to create a pivot table!