How to create a new data grid report from scratch
Version: Yurbi v12
Role: Builder or higher
Permission: Builder access to the application
Overview
In this guide, you will learn how to create a new data grid report from scratch in builder. We will talk about the process and, the different options to configure when creating a new data grid report.
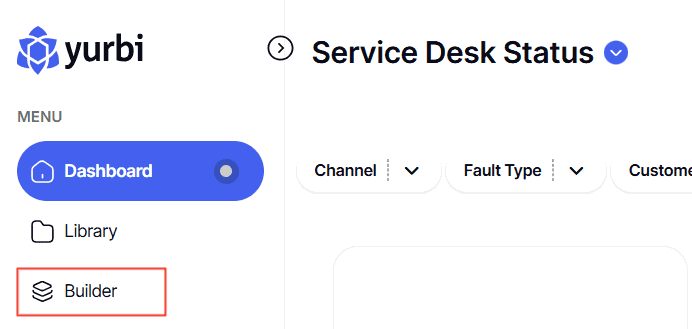
Accessing the Builder Section
1. Once logged in, click Builder
Creating the Report
Select Application and Report Type
1. Click the down arrow next to Select an App and Report Type to open the dropdown menu.
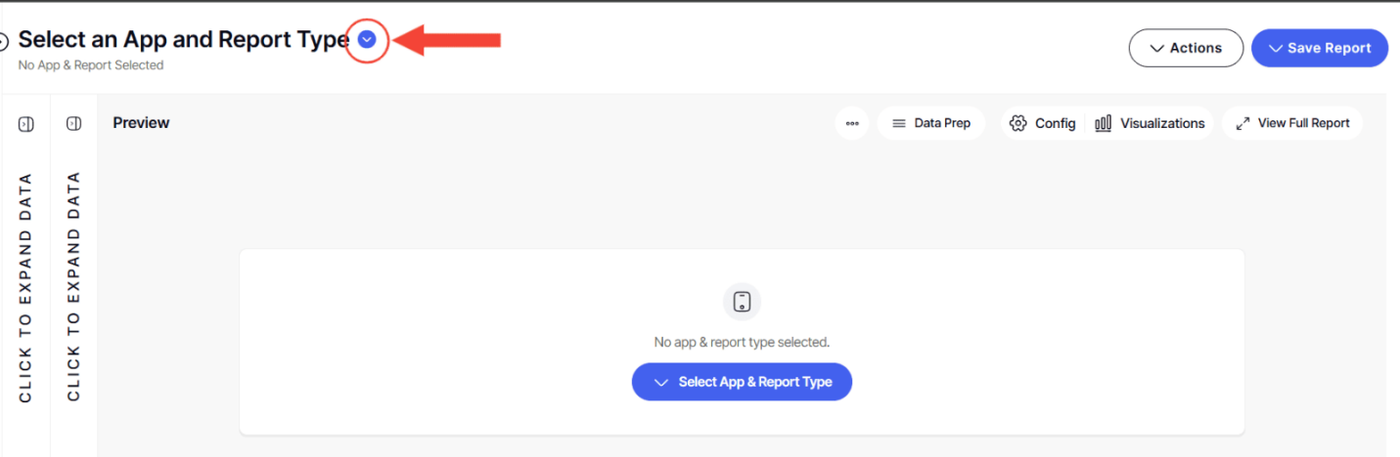
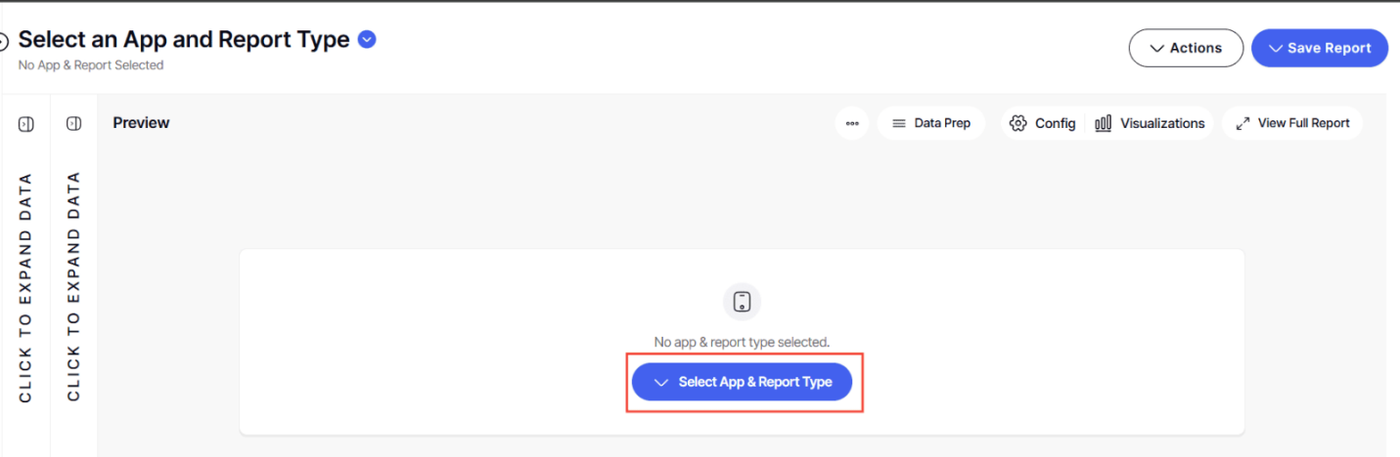
Or, Click the Select an App and Report Type button found in the middle of the interface
2. Choose the application you wish to build a report for. The options are the applications you are authorized as a report builder for.
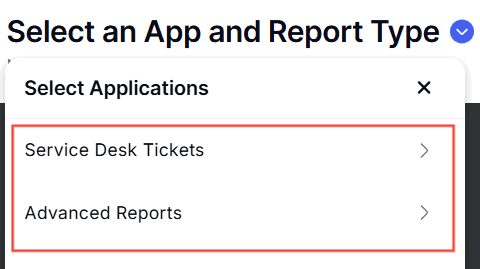
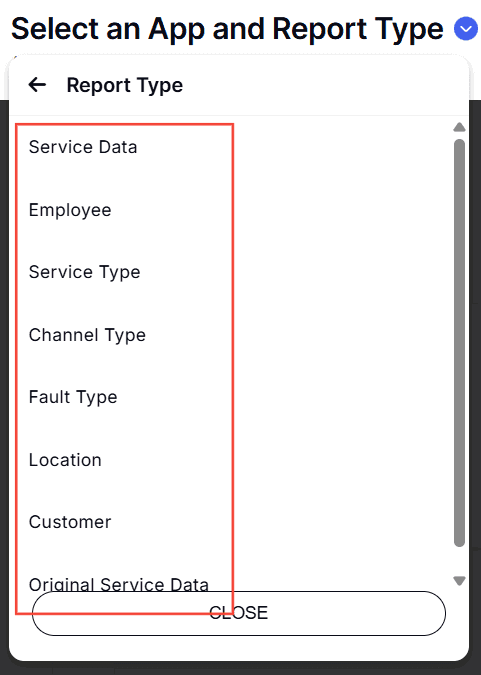
3. Now, pick the type of report you intend to create. Depending on the application, different report types will be available for your selection.
Building Your Report
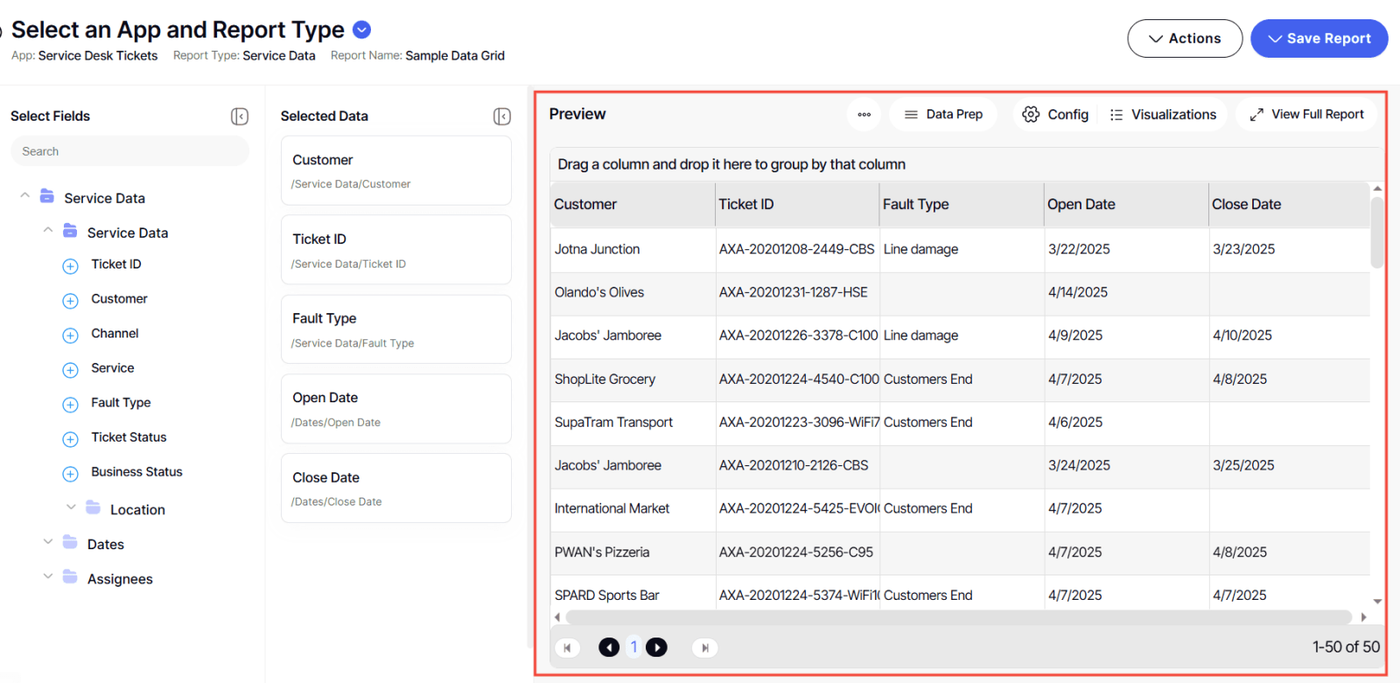
1. With a report type selected, a report tree will appear. This contains all possible fields for your report.
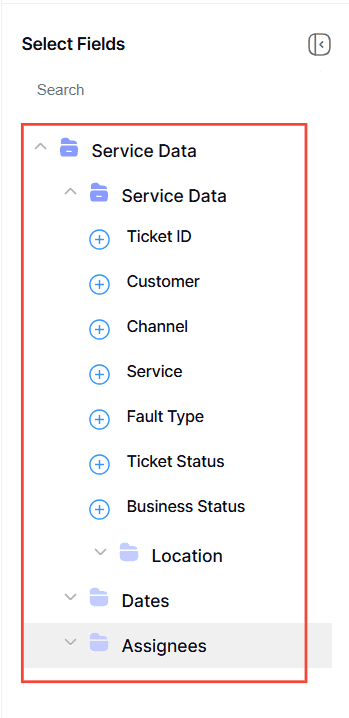
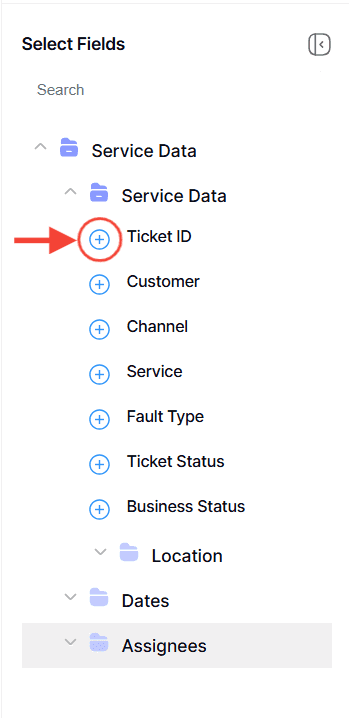
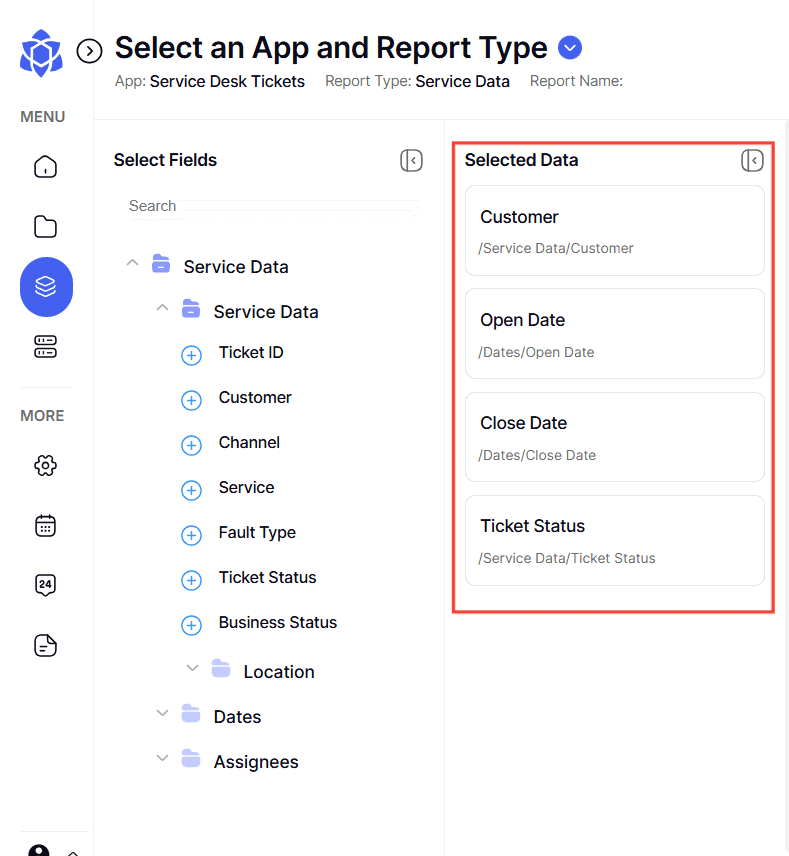
2. Click the plus icon (+) next to the fields you want to add. These will become the columns in your report and will be reflected in the preview area.
Customizing Report Structure
This section includes steps on arranging the fields you have selected and deleting a field you want.
1. Once you have selected a field, you can customize each of them in the report fields.
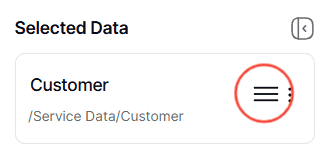
2. To rearrange columns, hover over a field to see three lines, then click the three lines and drag the field to move it.
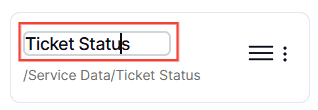
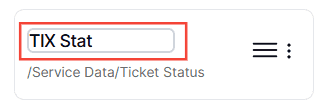
3. To rename a column, simply click on its name and type the desired new name.
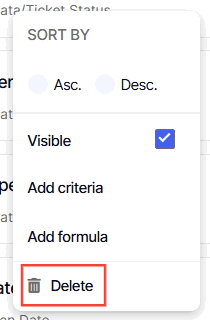
4. To remove a field, hover over it and click the three dots button.
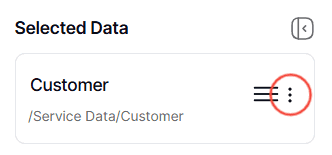
5. Select Delete
Configuring Data in Report Fields
This section covers the different options available within a field and how each of these options are useful when creating a report.
1. Each field features a three dots button for more configurations
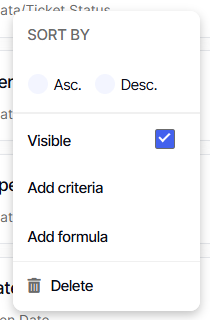
Sort: sort’s data of that field in either ascending or descending order
Visible: to make the field appear on the report. This is automatically enabled. Disabling this would make the field disappear on the report.
Add Criteria: Defines data filters for numbers, dates, or times.
Here is an article about configuring Add Criteria option
Add Formula: Implements calculations like those in Excel.
Here is an article about configuring Add Formula option
Preview Your Report
1. On the preview section, you can see the fields you added and configured. By default, it would show a standard output.
2. Under the three dots button, the user will find the following options
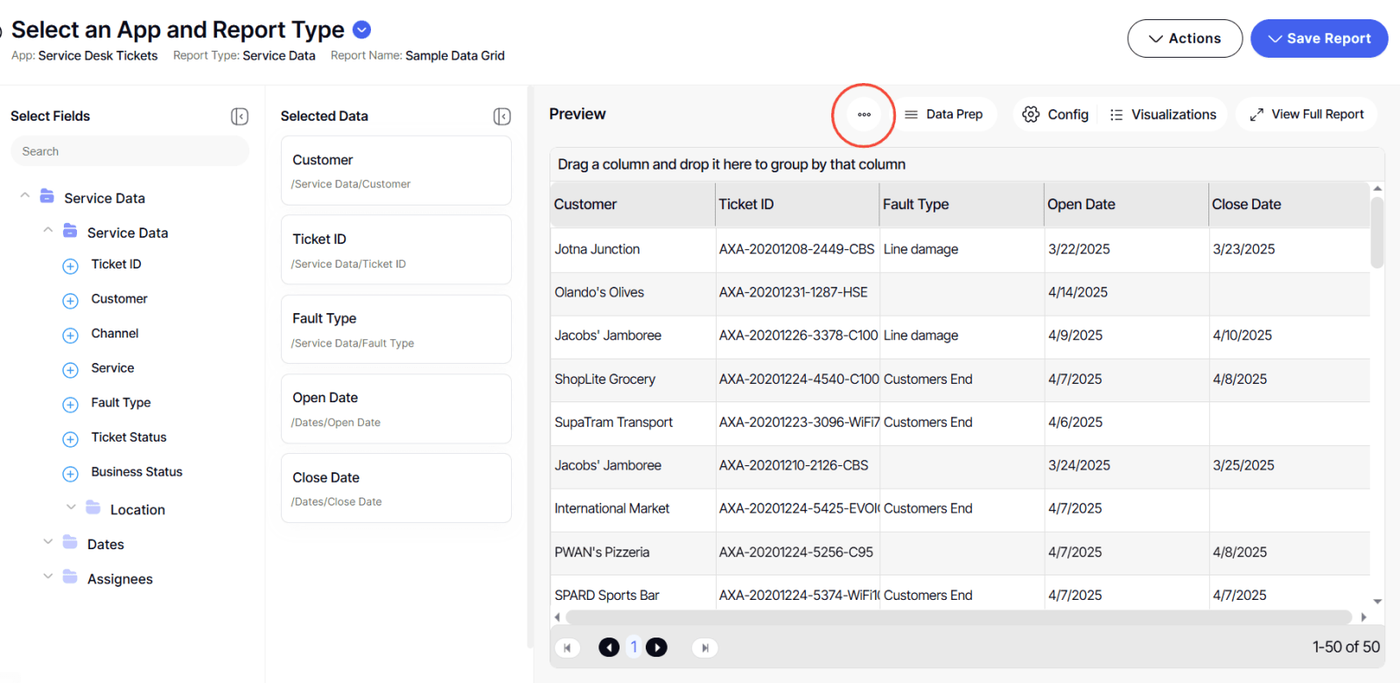
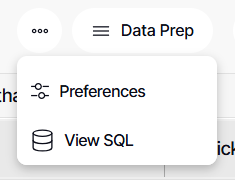
3. Under Preferences:

- Auto Preview : This function is enabled by default, showing changes in real time.
- Suppress Prompts : This is useful when a field has a prompt for values enabled. It suppresses the prompt in the preview section so that the prompt for values doesn’t keep appearing.
- Preview 50 Rows Limit : This feature is set by default to load only 50 records at once, protecting the database from heavy queries.
Here is an in-depth article about Preview Section
Save Your Report
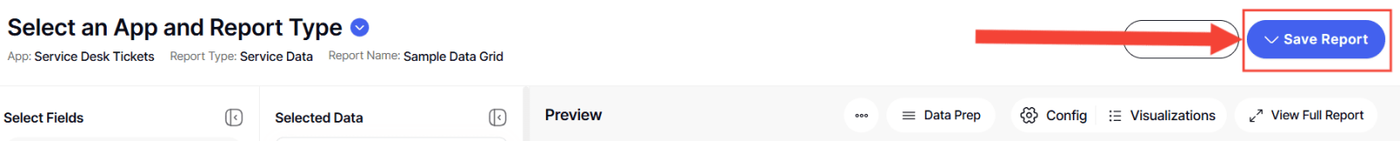
Remember when creating a new report, the only option you can do is to save the report once you have finished configuring it. Overwrite and Save As won’t be available as the report your creating is not existing at the moment.
1. Once the report meets your needs, click Save Report.
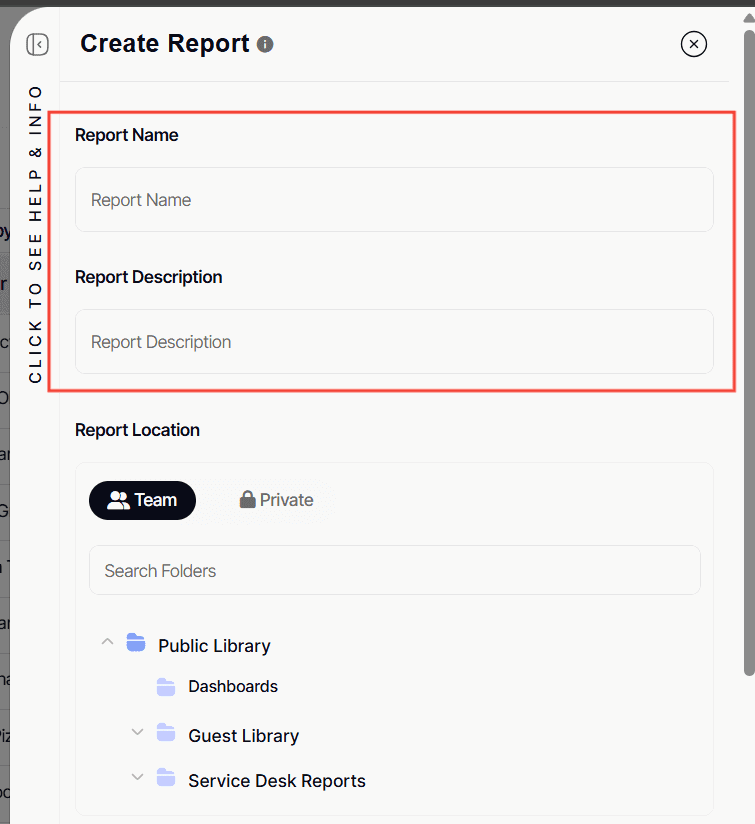
2. Enter a Report Name and Report Description.
3. Choose the folder where your report will be stored. If you haven't set specific permissions, the report will follow the folder's permissions.
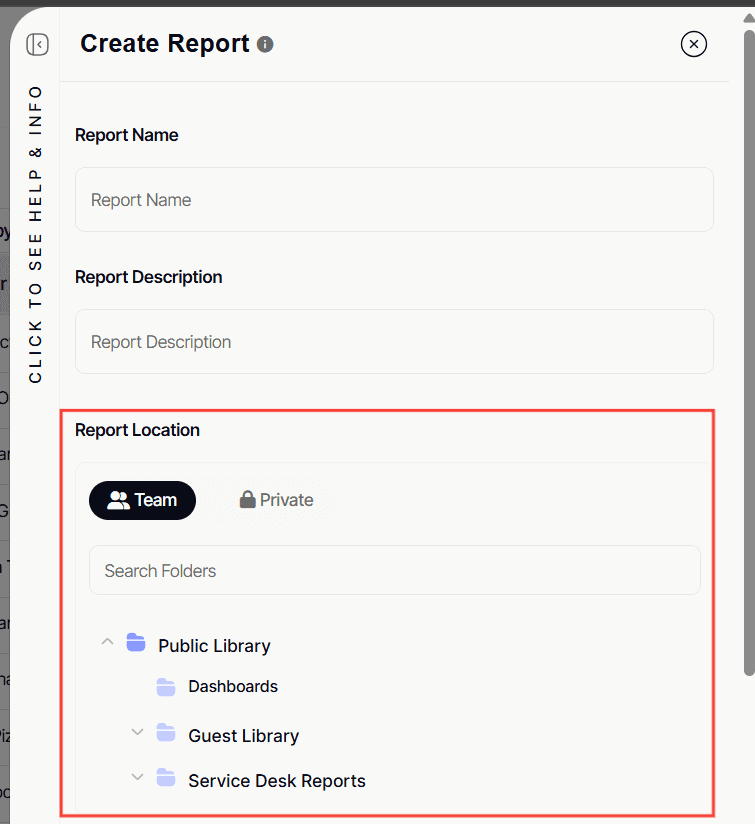
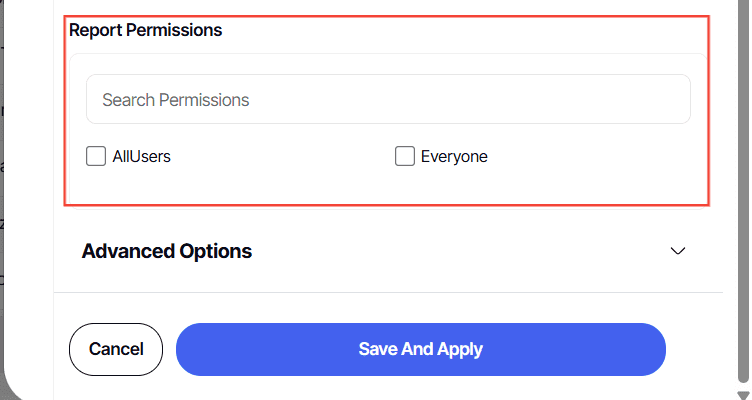
4. Choose Permissions for the report.
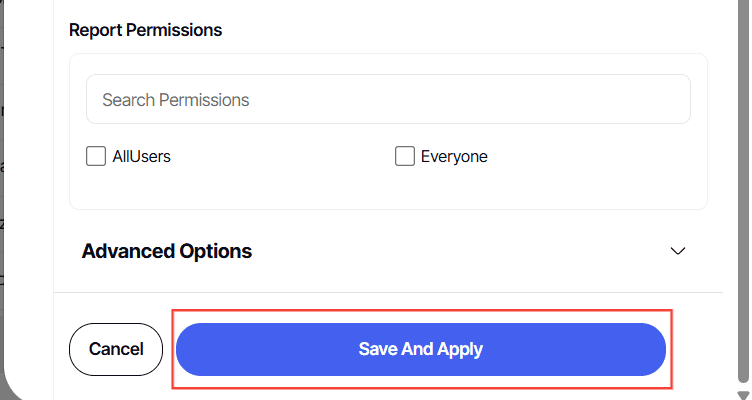
5. To complete the process, click Save And Apply.
Your report is now created and saved in the selected location.
And there you have it! You now know how to create a report from scratch!