How to create a bar/column chart visualization report
Version: Yurbi v12
Role: Builder or higher
Permission: Builder access to the application
Overview
A bar graph is best used in comparing values, highlighting distribution, ranking data, showing deviations, and comparing smaller data sets (as opposed to large quantities of data). It is a data visualization where data is displayed as horizontal bars going across the chart horizontally with the values axis being displayed on the bottom side of the chart.
A column graph is a type of graph is well-suited for showing comparisons over time, comparing different products or services, showing the distribution of data, and trend analysis. It is a data visualization where data is displayed as vertical bars going across the chart horizontally. The values axis being displayed on the left side of the chart.
Creating a chart visualization can either be through an existing report or when creating a new one.
When creating a bar or column chart it would need at least one character-based field and one numerical based field.
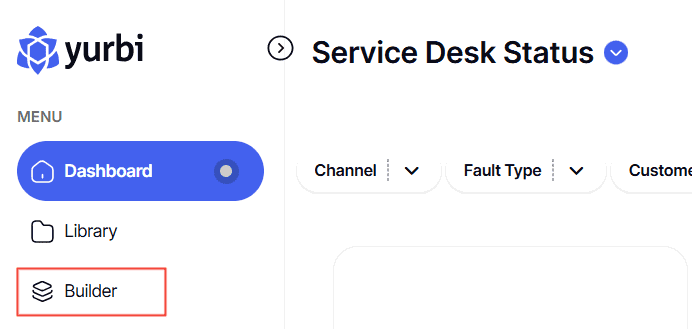
Accessing the Builder Section
This section shows the step on how you can access the builder section
1. Once logged in, click Builder option found at the left side bar.
Creating the Report
This section shows the steps on how you can create your report
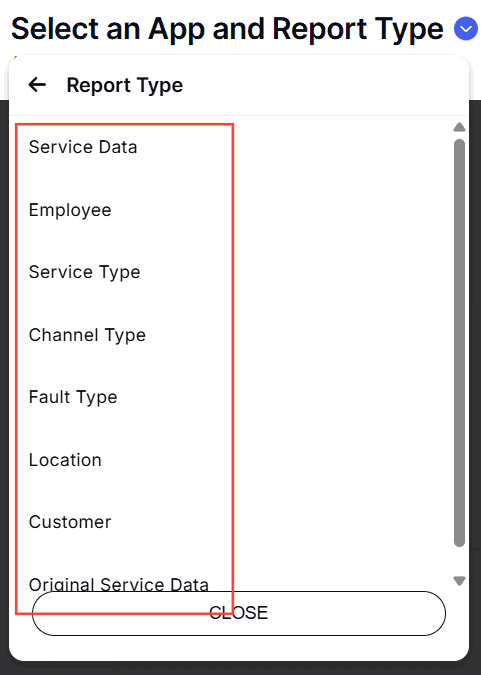
Select Application and Report Type
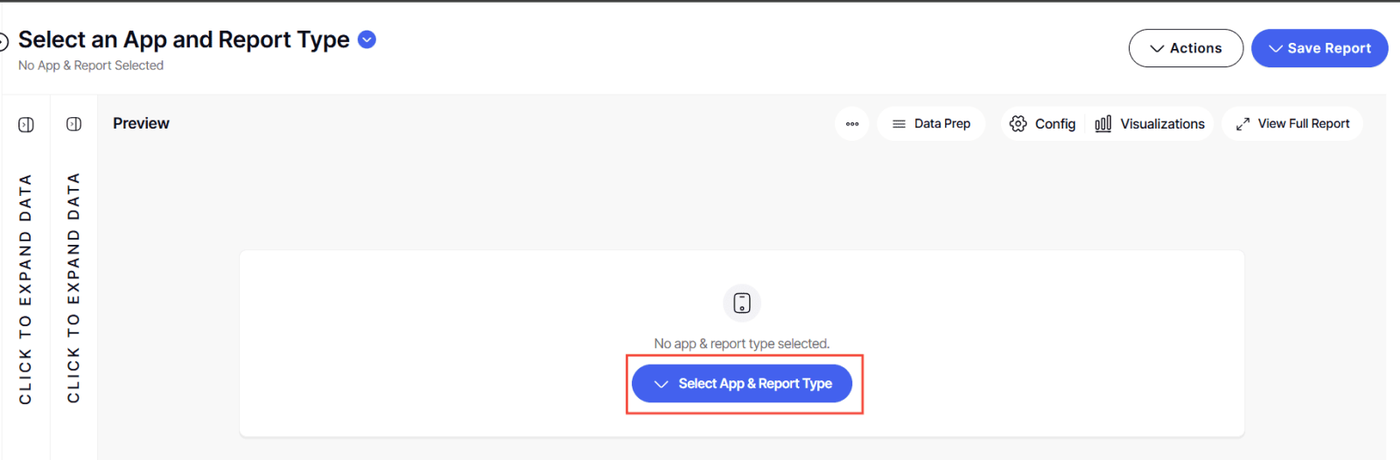
1. Click the down arrow next to Select an App and Report Type to open the dropdown menu.
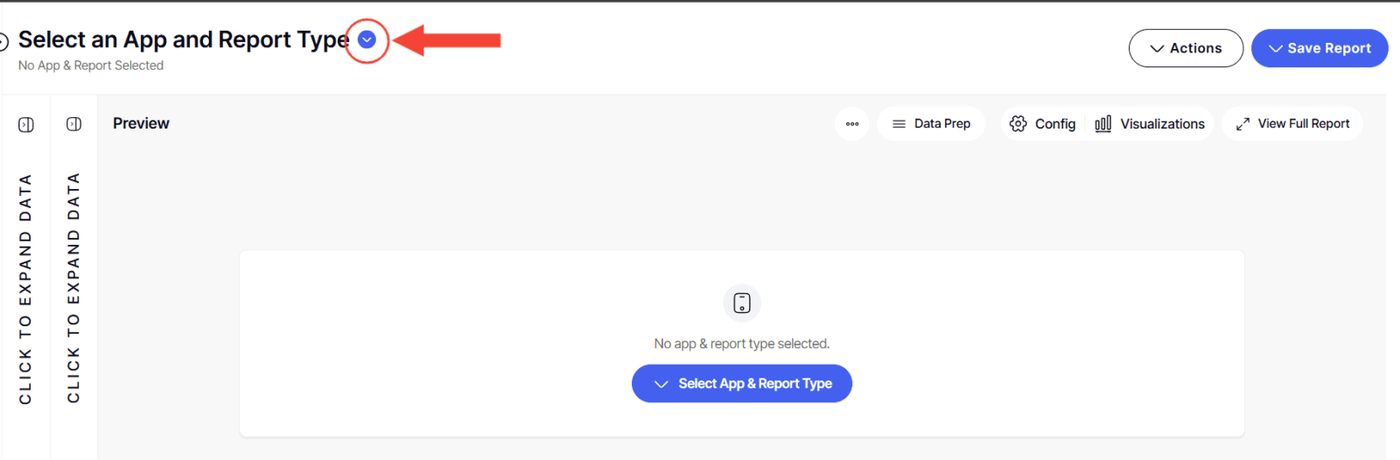
Or, Click the Select an App and Report Type button found in the middle of the interface
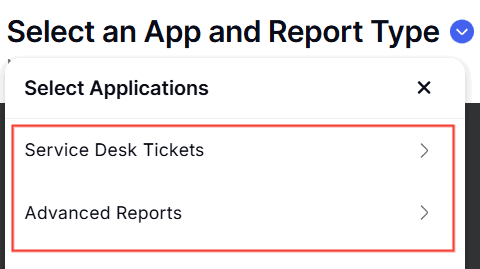
2. Choose the application you wish to build a report for. The options are the applications you are authorized to modify.
3. Now, pick the type of report you intend to create. Depending on the application, different report types will be available for your selection.
Building Your Report
This section shows the steps on how you can build from the report you created
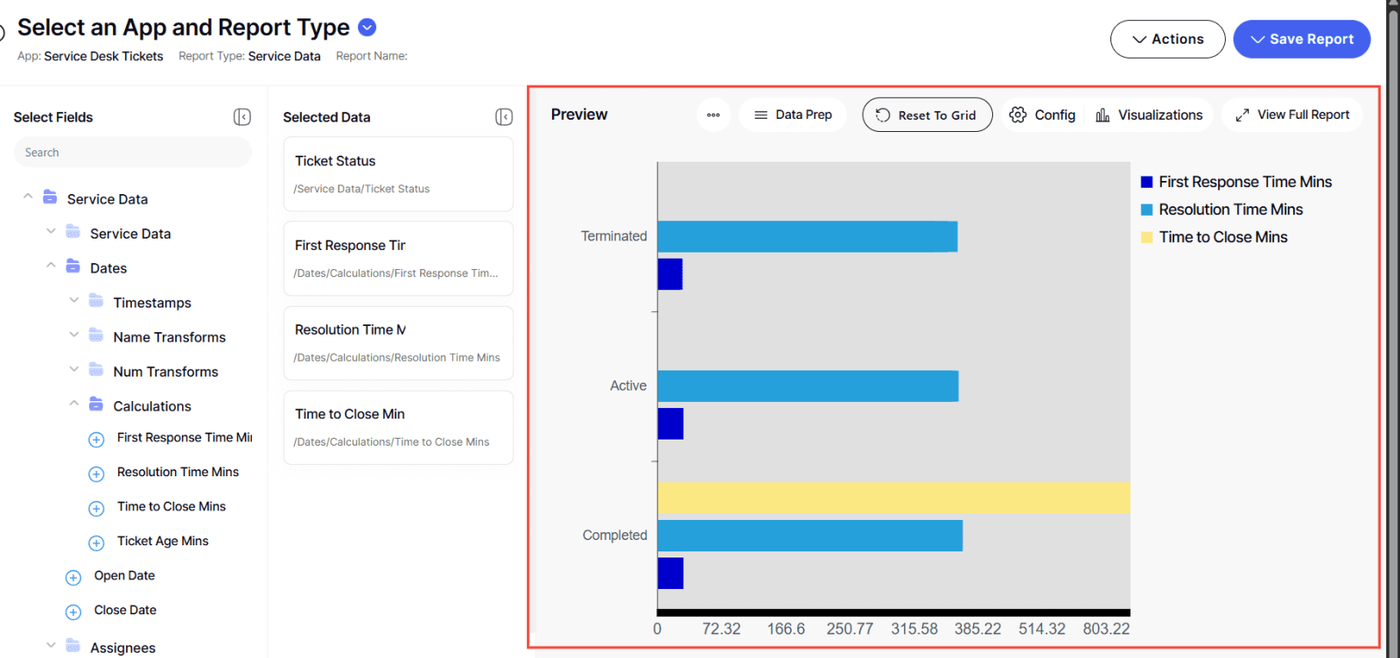
1. With a report type selected, a report tree will appear. This contains all possible fields for your report.
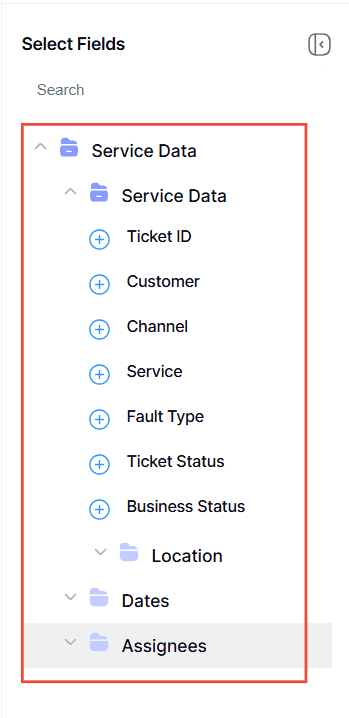
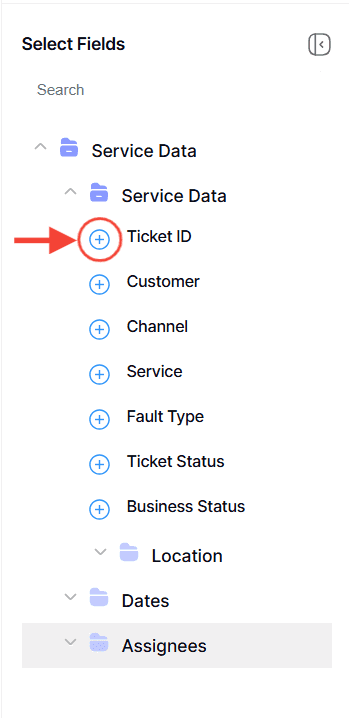
2. Click the plus icon (+) next to the fields you want to add. These will become the columns in your report and will be reflected in the preview area.
For more in depth process, here is an article on how to create a new data grid report from scratch.
Configuring Bar Chart Visualization
This section shows the steps on how you can configure the report you created into a bar chart
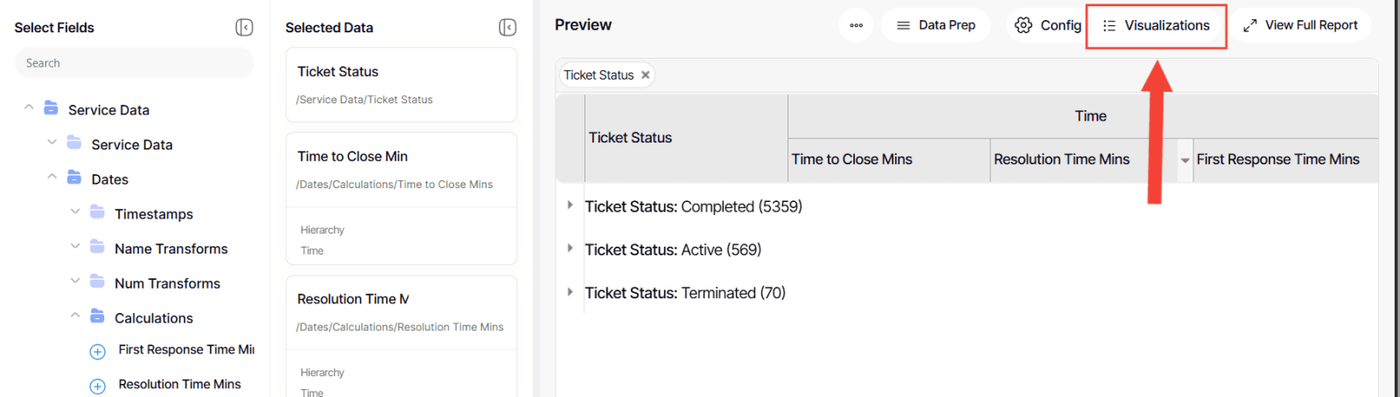
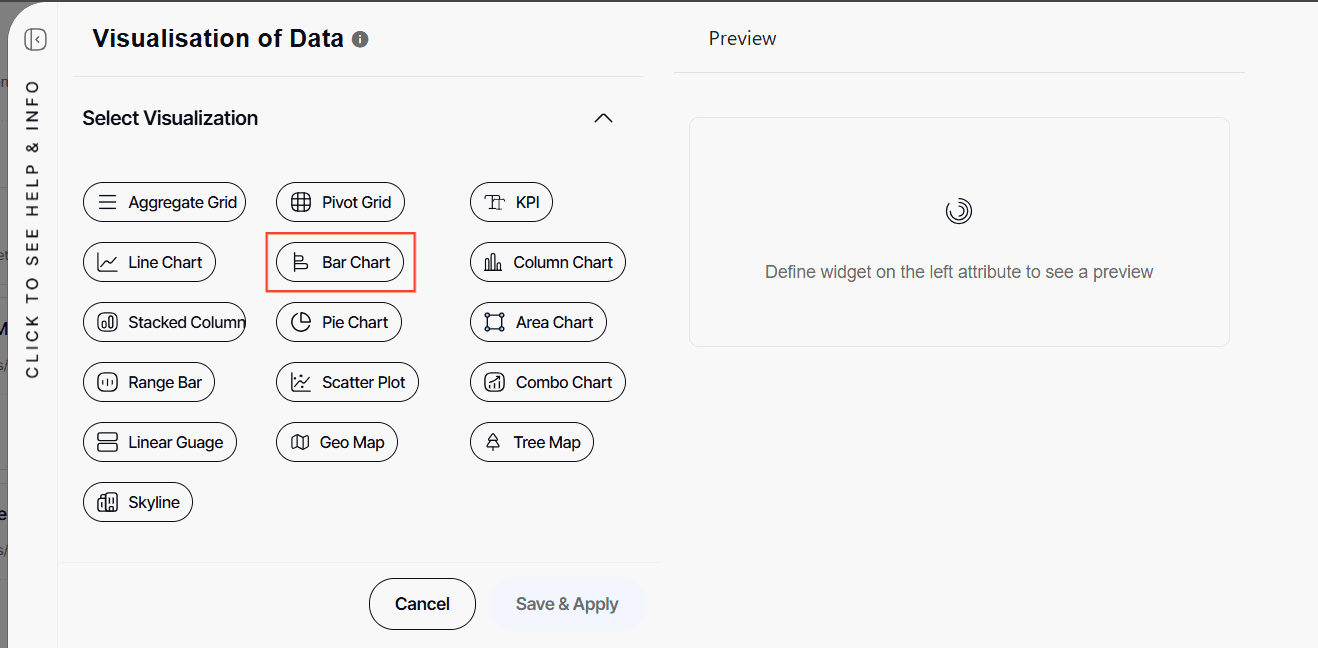
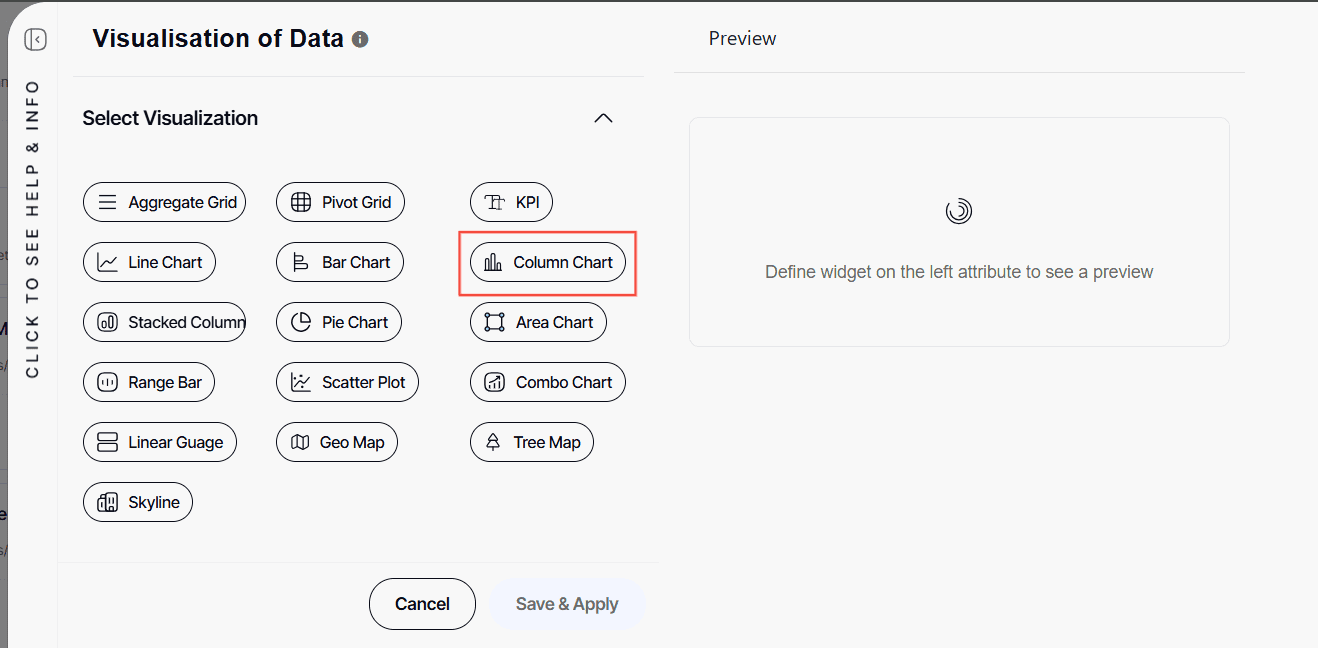
1. Once you have selected your report fields, Click Visualization
2. Select Bar Chart
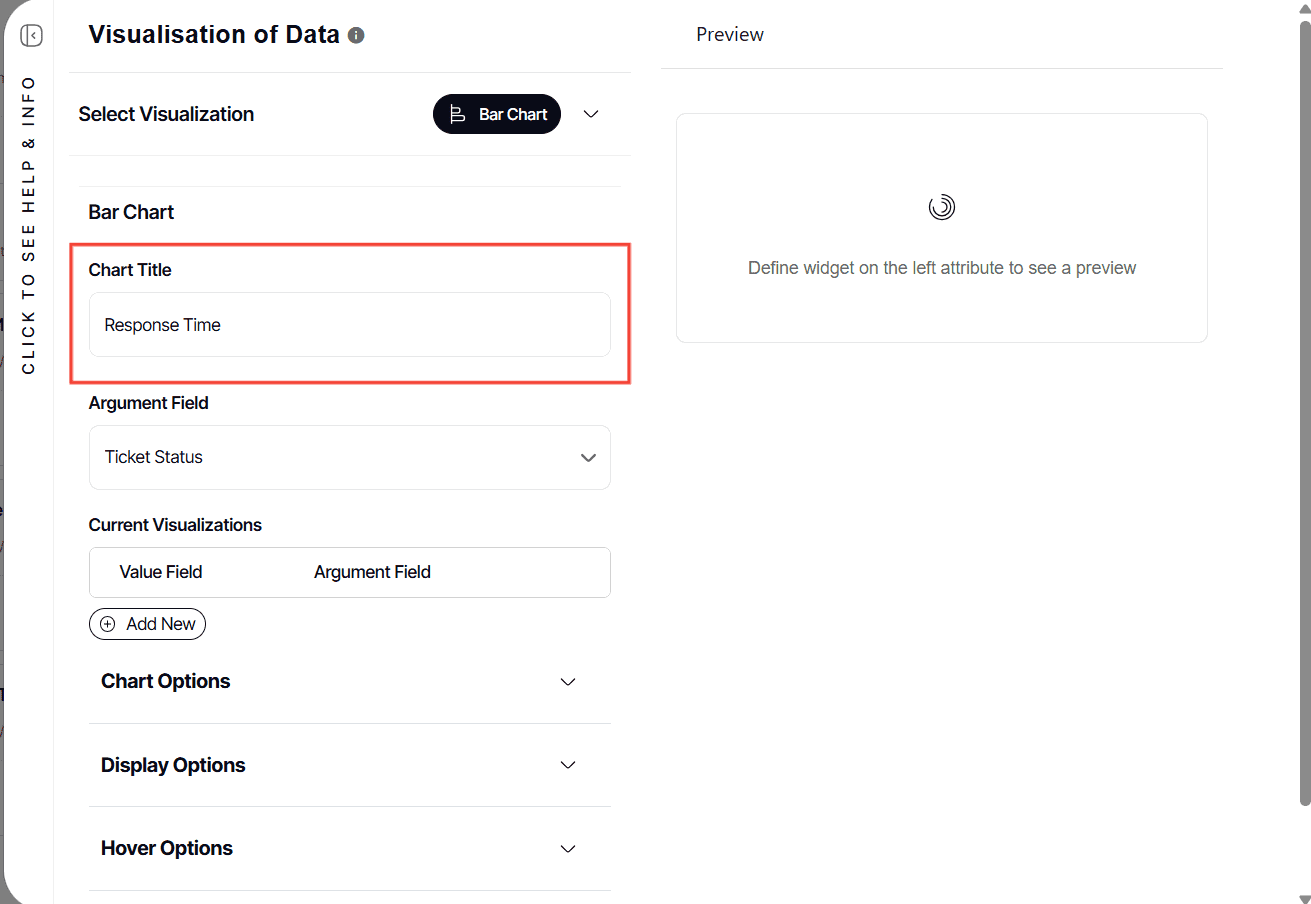
3. Type in Chart Title
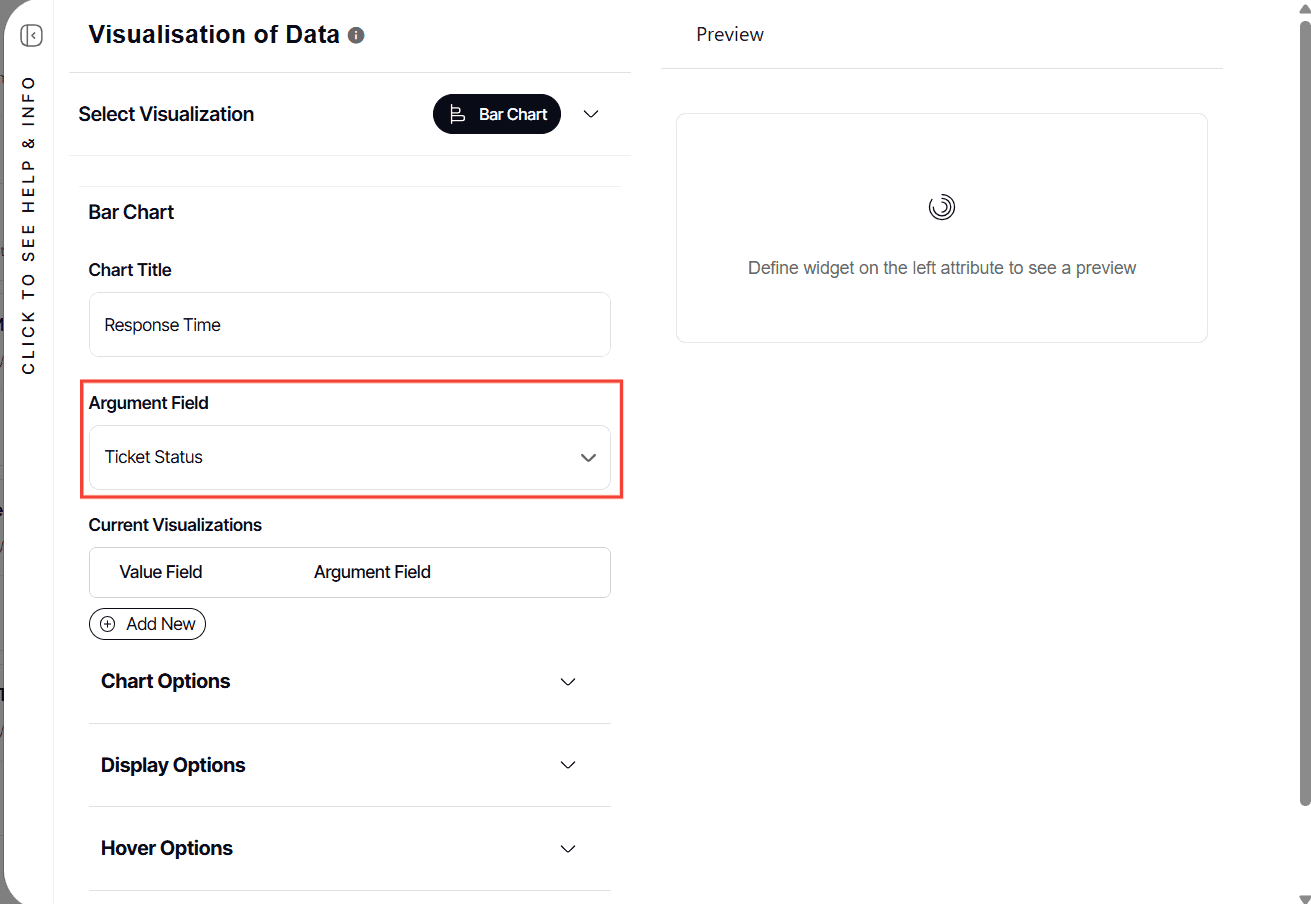
4. Select Argument Field
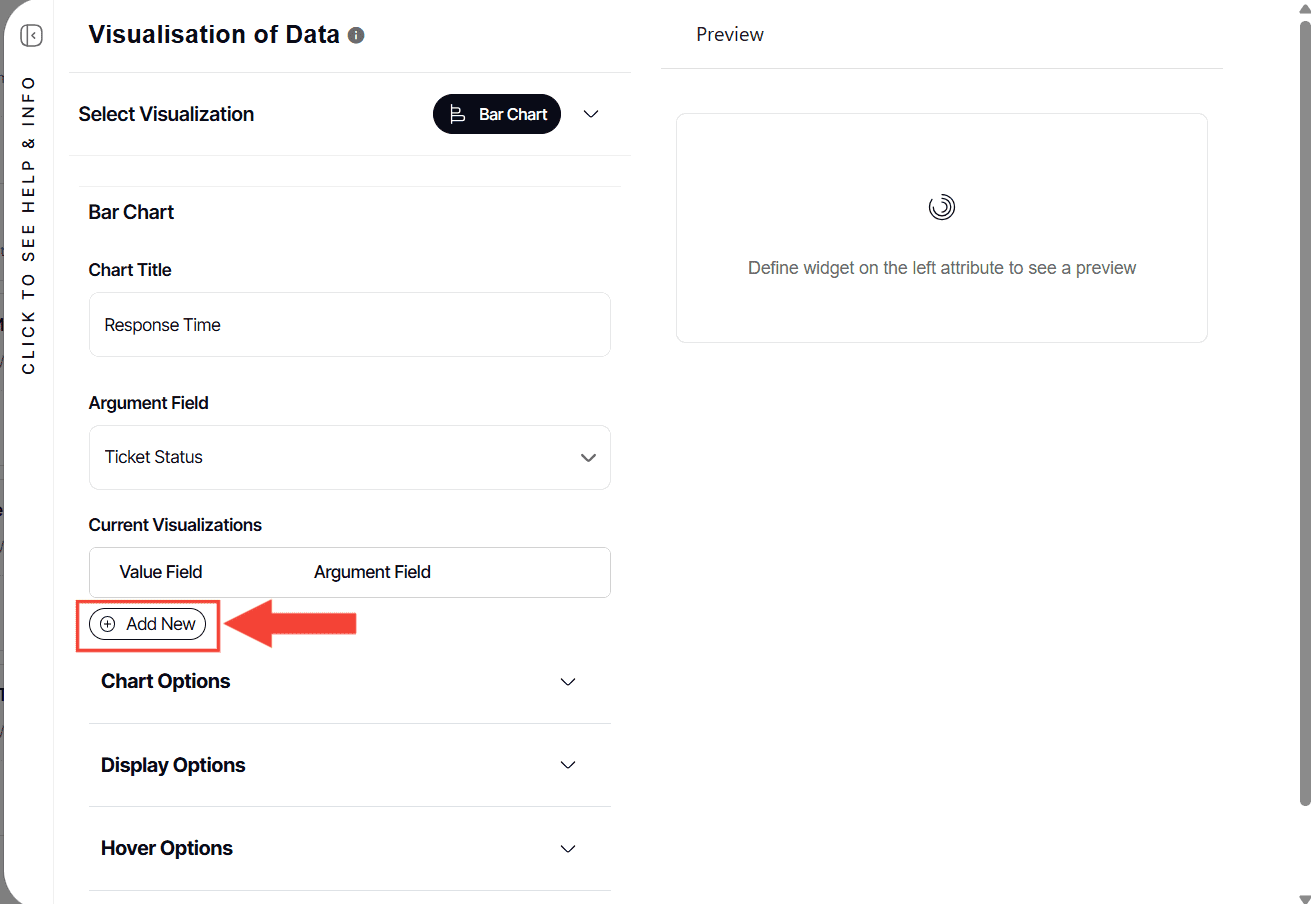
Current Visualization
1. Under Current Visualization, select Add New
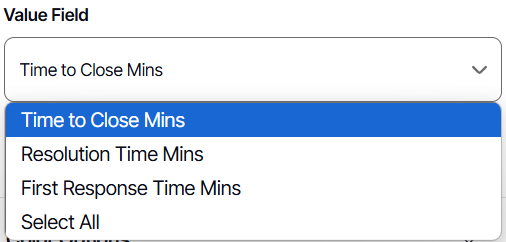
2. Select your desired Value Field
3. In Values Options, select your Label Formats

4. Leave Precision as 0
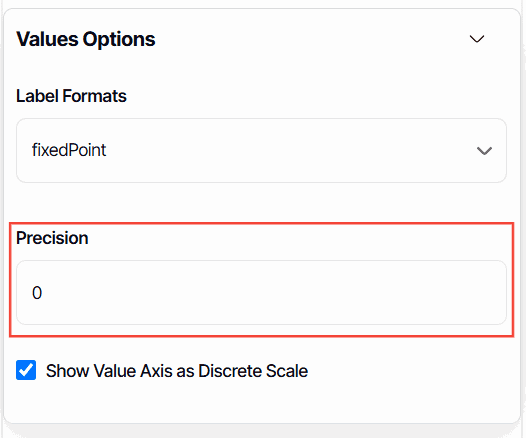
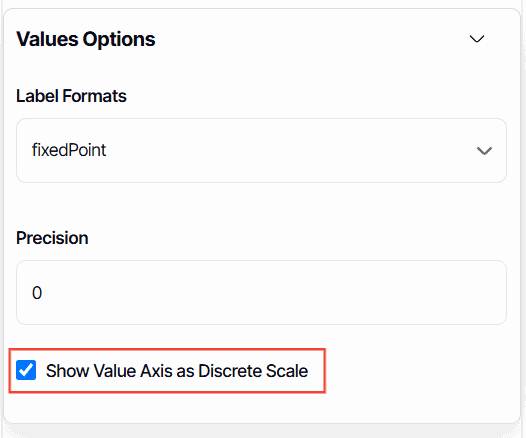
5. Tick or untick Show Value Axis as Discrete Scale
This means that the value shown will only be finite number of possible values and can only be whole numbers.
6. Click Color Options
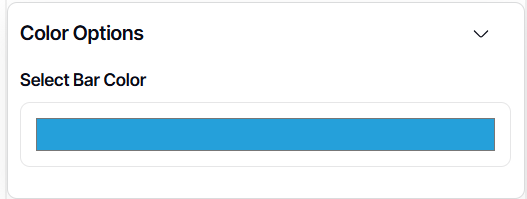
7. Select your desired color
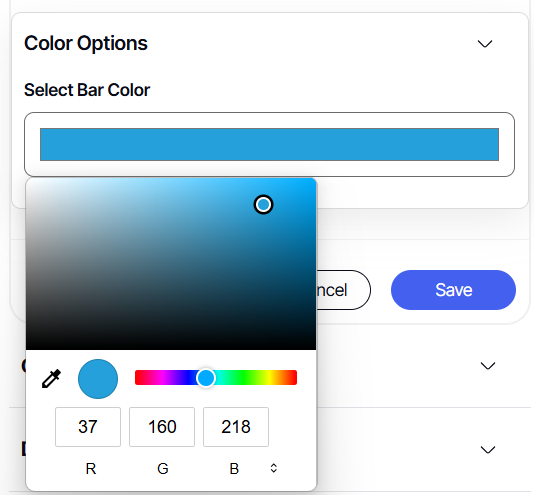
8. Once done, click Save

9. A preview of your configuration will appear under Current Visualization
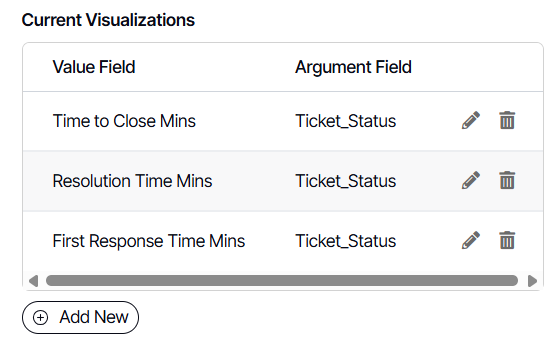
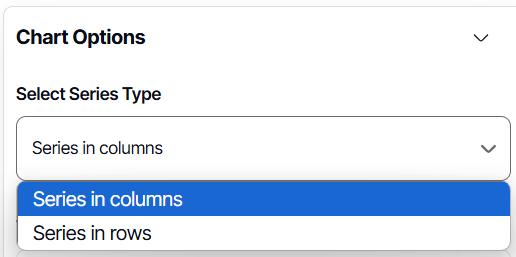
Chart Options
1. Under Chart Options, select your desired Series Type
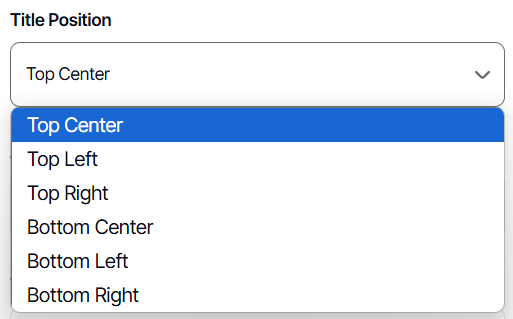
2. Select where you want your Chart Title positioned to be
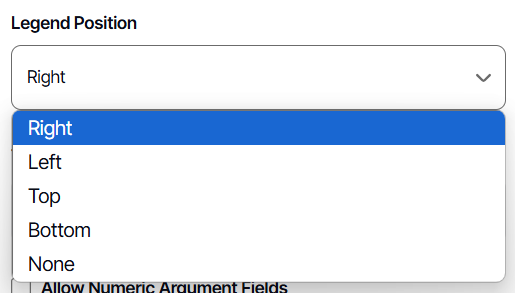
3. Select where you want your Legend Position to be
Display Options
1. Tick off the following checkbox if desired:
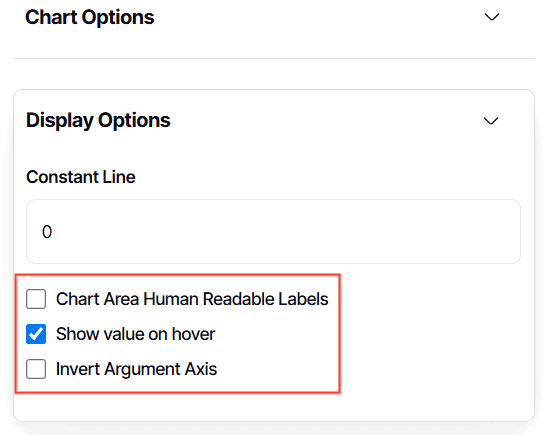
- Chart Area Human Readable Labels – shows the exact value of each bar in the chart
- Show value on hover – when you hover on the bar/column part of the report, it will show you exactly the value of that bar/column.
- Invert Argument Axis – changes the axis of the values the opposite of what is originally shown
2. After all the configuration, Click Save & Apply

3. The chart visualization you have created will automatically reflect in the Preview section.
Configuring Column Chart Visualization
This section show the step on how you can configure the report you created into a column chart
1. When creating a column chart visualization, all you need to do is select Column as a Chart Type. The rest of the steps are the same as when you are creating a bar chart visualization.
And there you have it! You now know how to create a bar or column chart visualization!