How to use color conditional row highlighting in the Aggregate Grid
Version: Yurbi v12
Role: Builder or higher
Permission: Builder access to the application
Overview
Color conditional row highlighting in the Aggregate Grid is useful when you want to highlight a field based on the value you configure for easier look on the report. This could be used when one needs to highlight a category with values such as In Progress, Opened, and Closed with different color corresponding to each of those values, it can also be used when two columns are being compared of their values.
You can add more than one color conditional row highlight in the Aggregate Grid.
Configuring Data Row Conditional Highlighting
This section covers the step by step process on how to configure the Data Row Conditional Highlighting to create color highlights in your report.
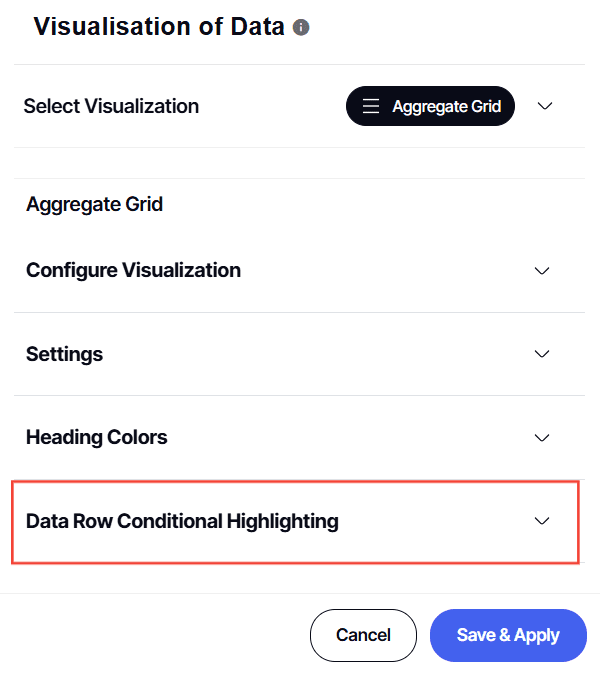
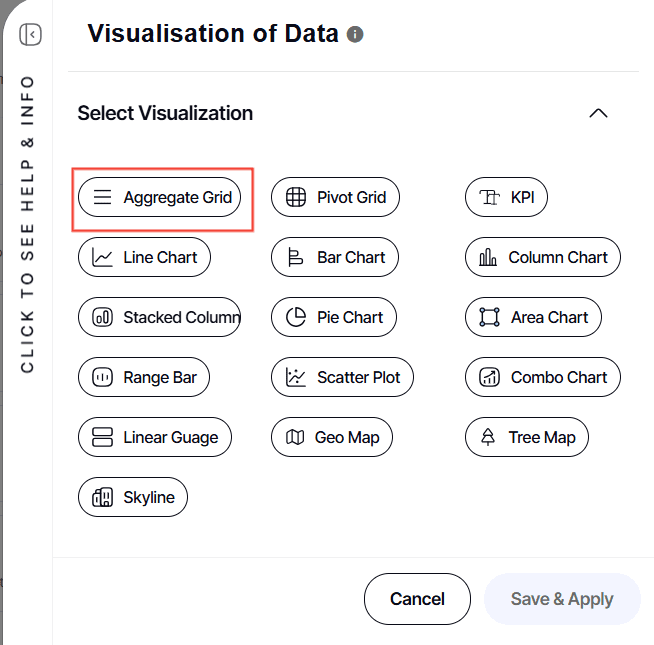
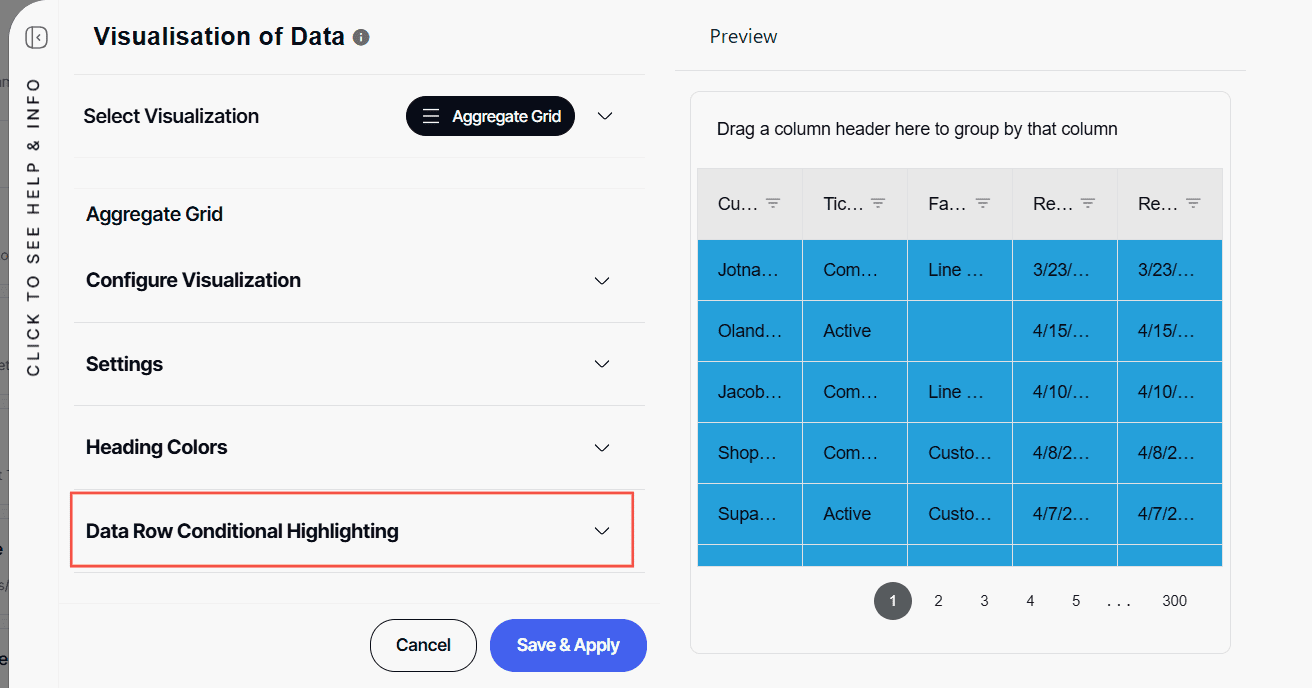
1. To use color conditional row highlight, in the builder section, select Visualization under the preview section.
![]()
2. Click Aggregate Grid

3. Click Data Row Conditional Highlighting section to view the configuration.
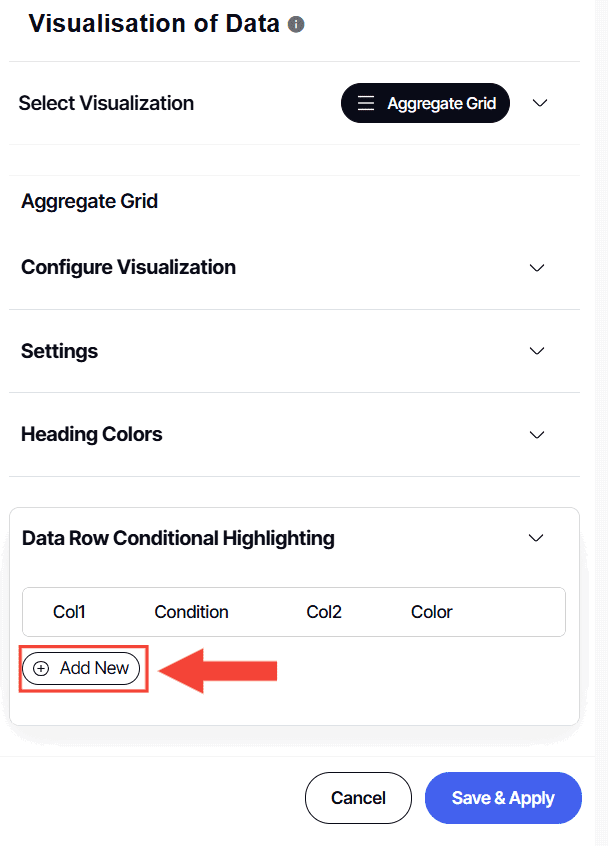
4. Click Add New
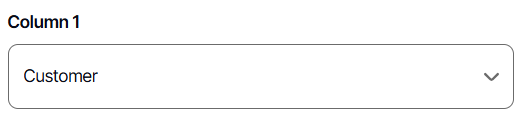
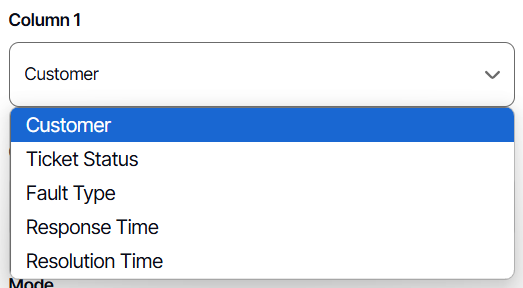
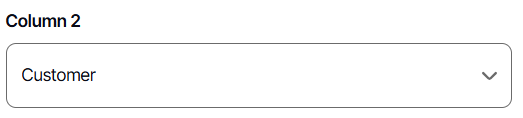
5. Choose your Column 1 value from the drop-down menu. The available selection will be based on the fields added to the report.
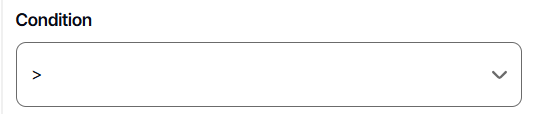
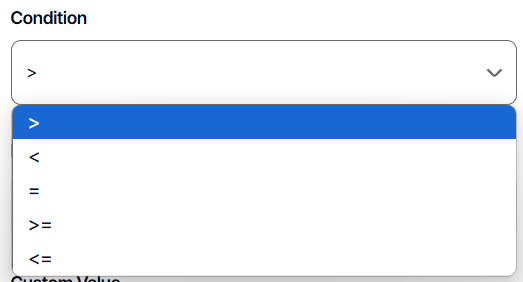
6. Next configure the Condition, selecting from the drop down menu. The options available are greater than sign, lesser than sign, equal sign, greater than or equal sign, and lesser than or equal sign.
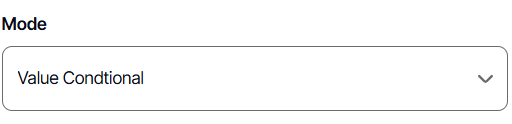
7. Next would be to configure your Mode value. Value conditional would only ask for the value for what it would be looking for depending on the Column 1 value. Column Comparison would ask for the Column 2 value.
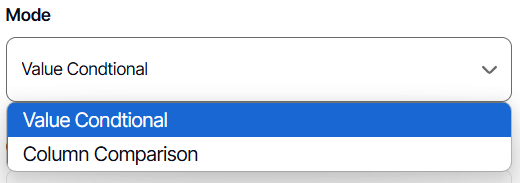
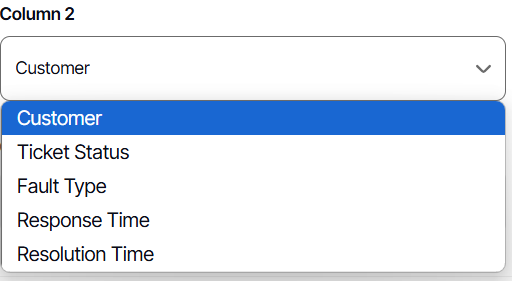
8. If Column Comparison is selected, configure your Column 2 value. It is useful when doing a comparison of two columns whose value are numerical. 

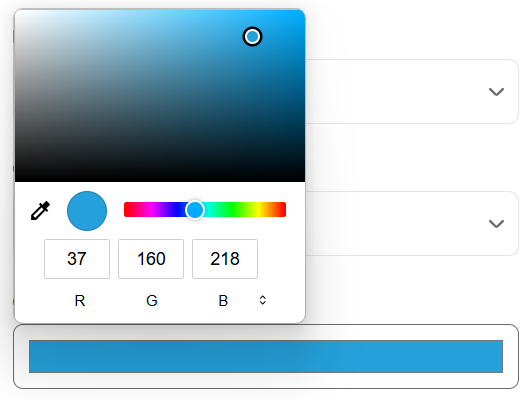
9. Under Color, click the bar and configure the color you want.
10. Once everything is configured to your liking, click Save.

11. Click Save & Apply.

Any changes made will immediately reflect in the Preview Section.
Deleting Color Conditional Row Highlight
This section covers on how you can delete an Data Row Conditional Highlighting found in your aggregate grid report.
1. To delete a color conditional row highlight, click Visualization in the preview section.
![]()
2. Select Aggregate Grid.
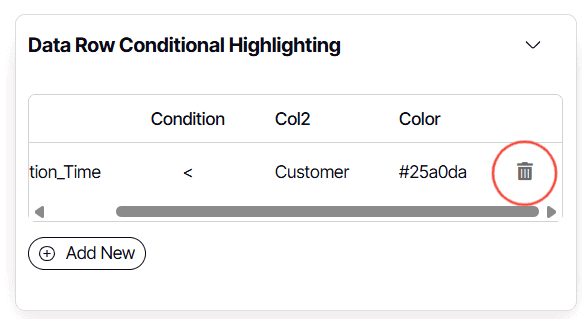
3. Click Data Row Conditional Highlighting section to configure existing color conditional row highlight.
4. Click the trash icon at the far-right end.
5. Click Save & Apply.

And there you have it! You now know how to use the Data Row Conditional Highlighting found in the Aggregate Grid Report!