How to configure a Pivot Grid Report
Version: Yurbi v12
Role: Builder or higher
Permission: Builder access to the application
Overview
Pivot Grid Report is another take on a report with total and subtotal feature. It is a report without configuring each field under the report fields. This type of output shows each step on configuration real time due to having a preview section during its build.
Example would be when adding a field under the column, row, or data section each field added is shown in the preview section. If the field under data is configured to have a sum function with format as currency, again these changes are shown real time in the preview section.
This is helpful when you need a report that shows the important facts and not all details.
Also, as of now, drill-down capabilities do not exist within an advanced pivot grid type of report.
Accessing the Builder Section
Once logged in, click Builder option found at the left side bar.
Creating Advanced Pivot Report
Select Application and Report Type
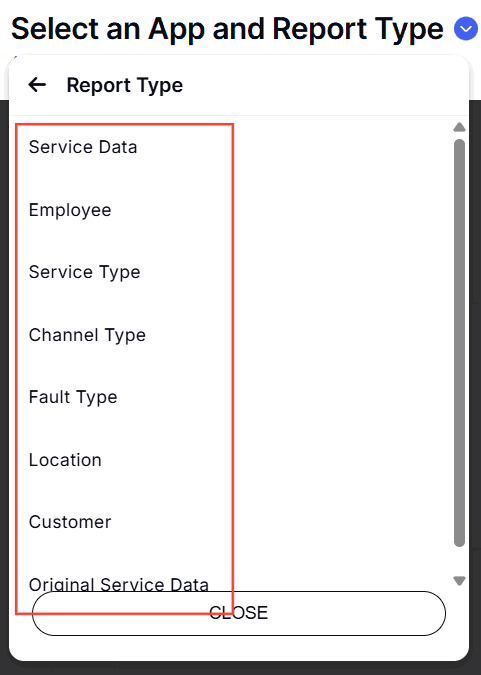
1. Click the down arrow next to Select an App and Report Type to open the dropdown menu.
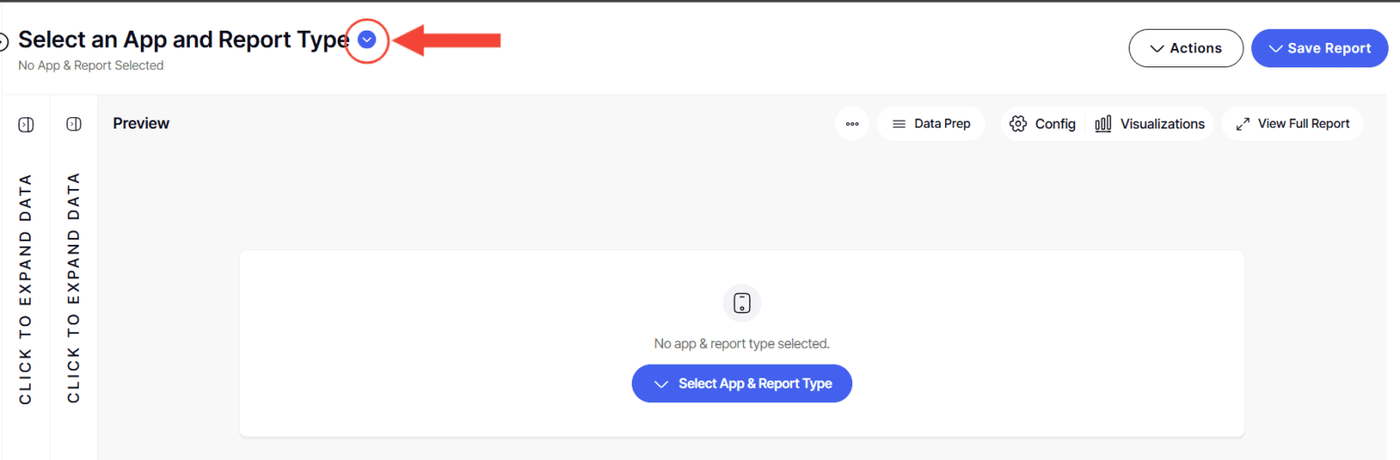
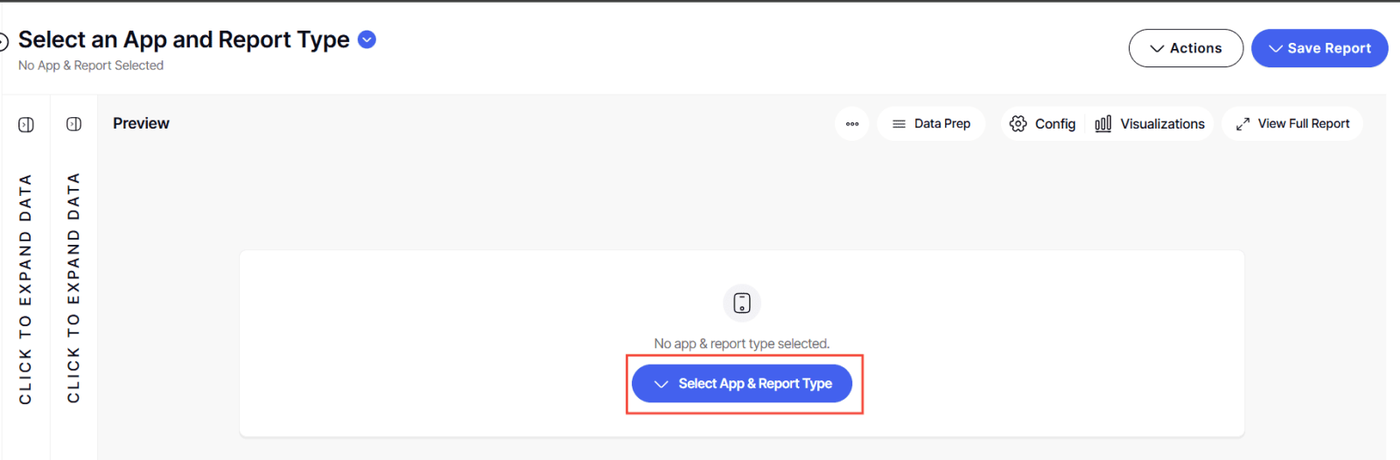
Or, Click the Select an App and Report Type button found in the middle of the interface
2. Choose the application you wish to build a report for. The options are the applications you are authorized as a report builder for.
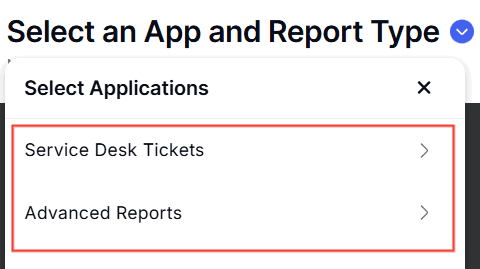
3. Now, pick the type of report you intend to create. Depending on the application, different report types will be available for your selection.
Building Your Report
This section covers the step by step process of configuring an pivot grid report. It includes how to arrange the fields and how you can configure the data of these fields.
1. With a report type selected, a report tree will appear. This contains all possible fields for your report.
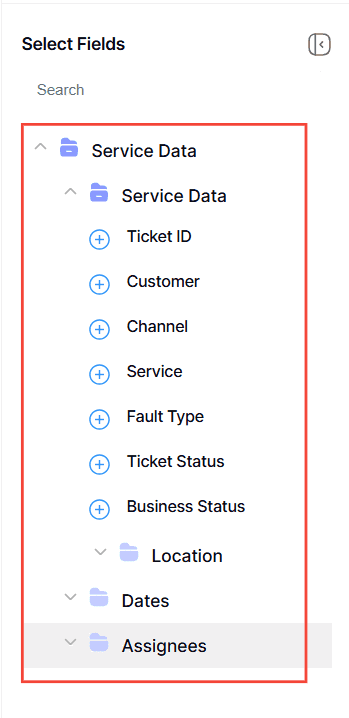
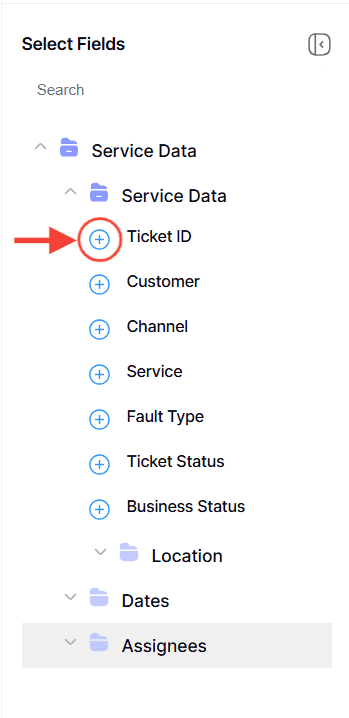
2. Click the plus icon (+) next to the fields you want to add. These will become the columns in your report and will be reflected in the preview area.
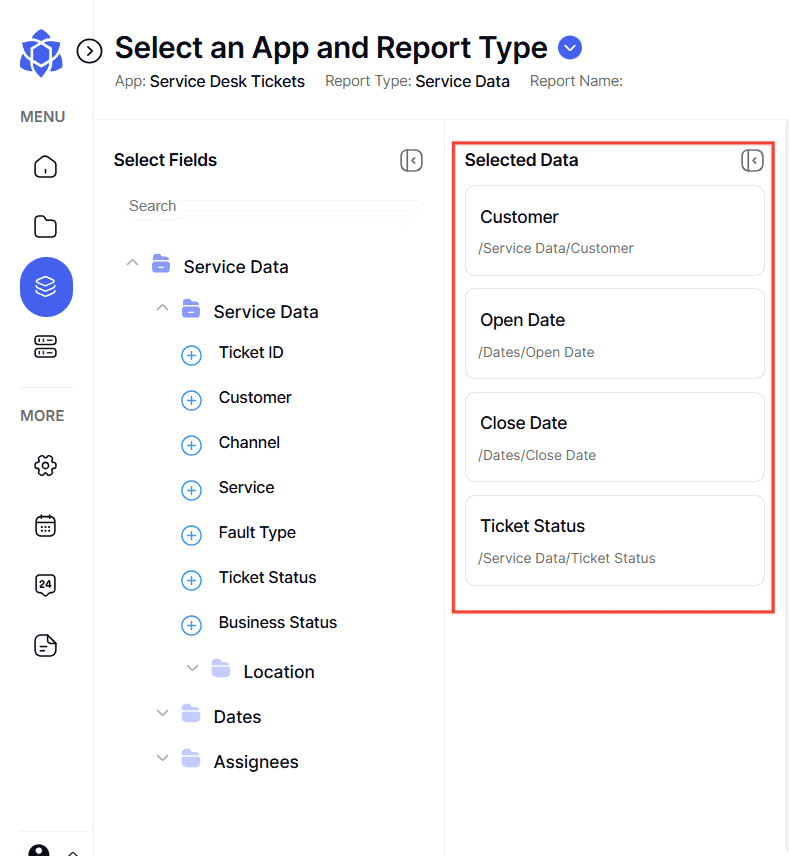
3. Once you have your selected fields, they will appear in the report fields section.
4. Under Preview Section, click Visualization
![]()
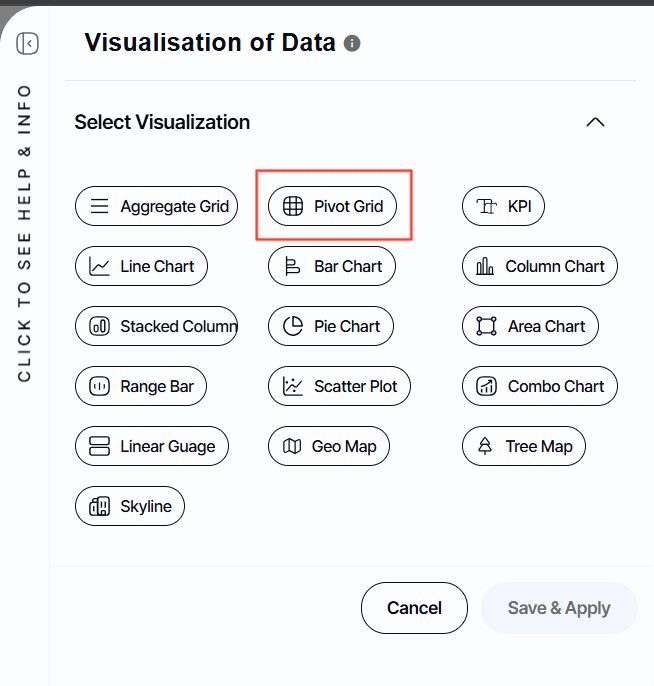
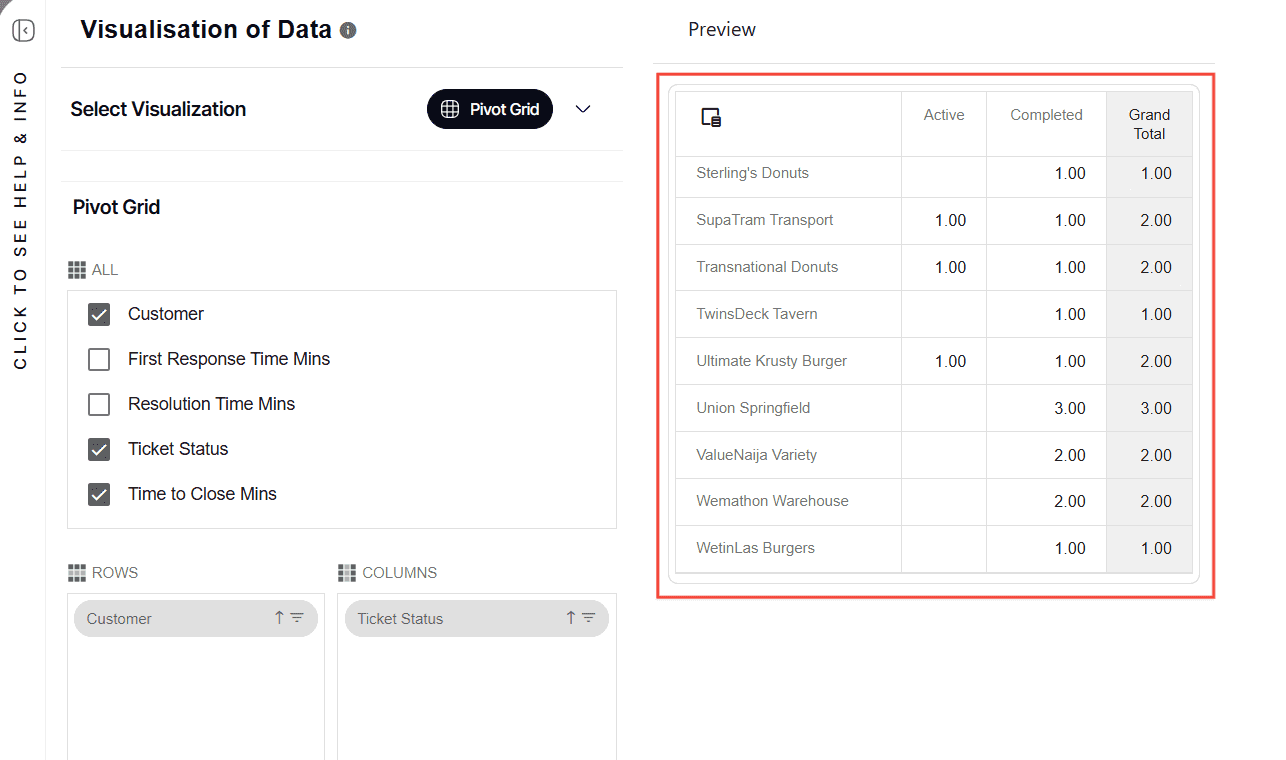
5. Select Pivot Grid
6. Under All, select the fields you want to include in your report by ticking off the checkbox.
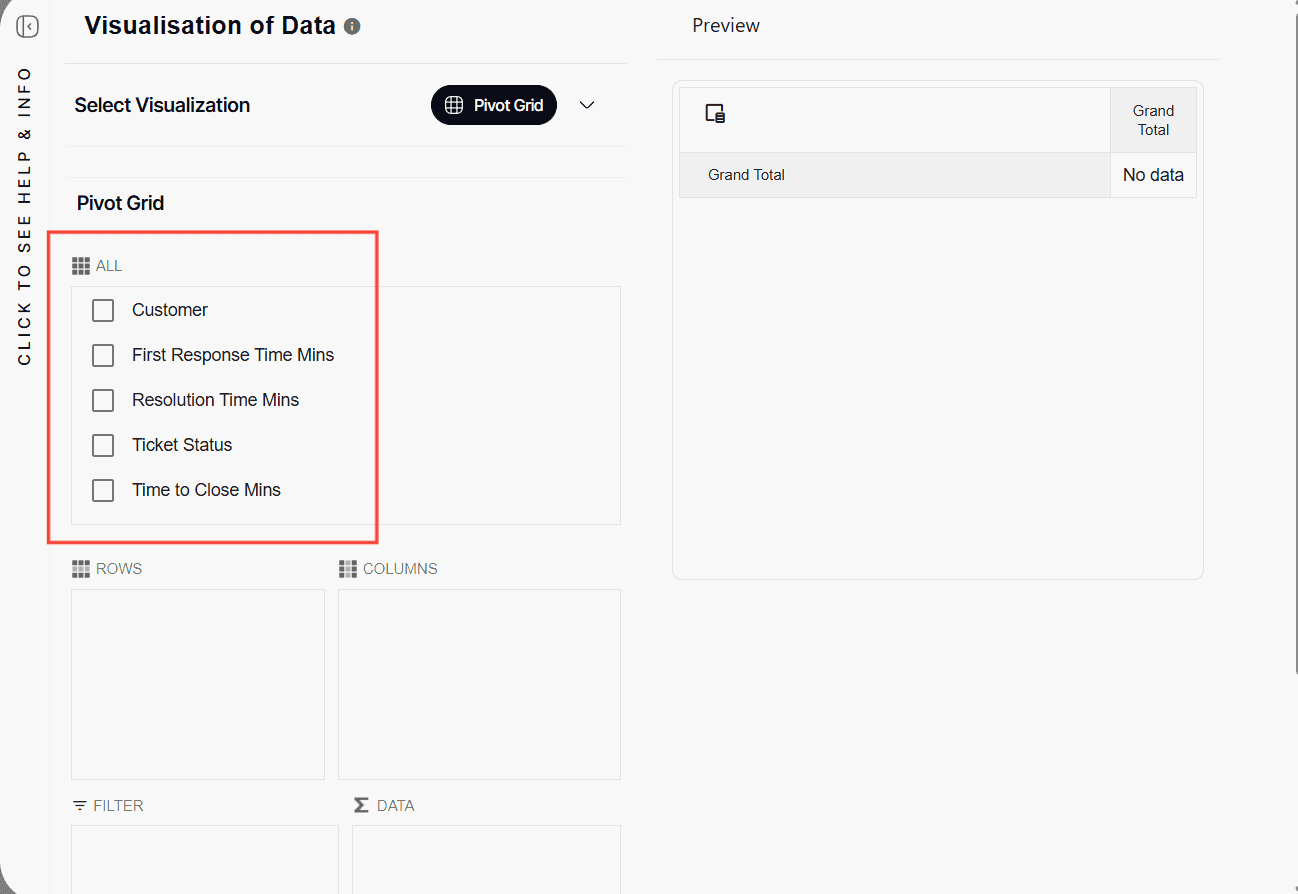
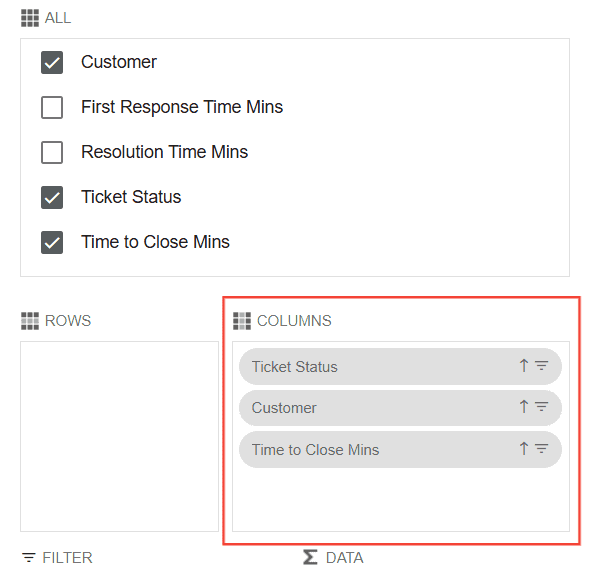
7. Any selected field will appear under COLUMNS
8. You can drag this fields either in ROWS or DATA.
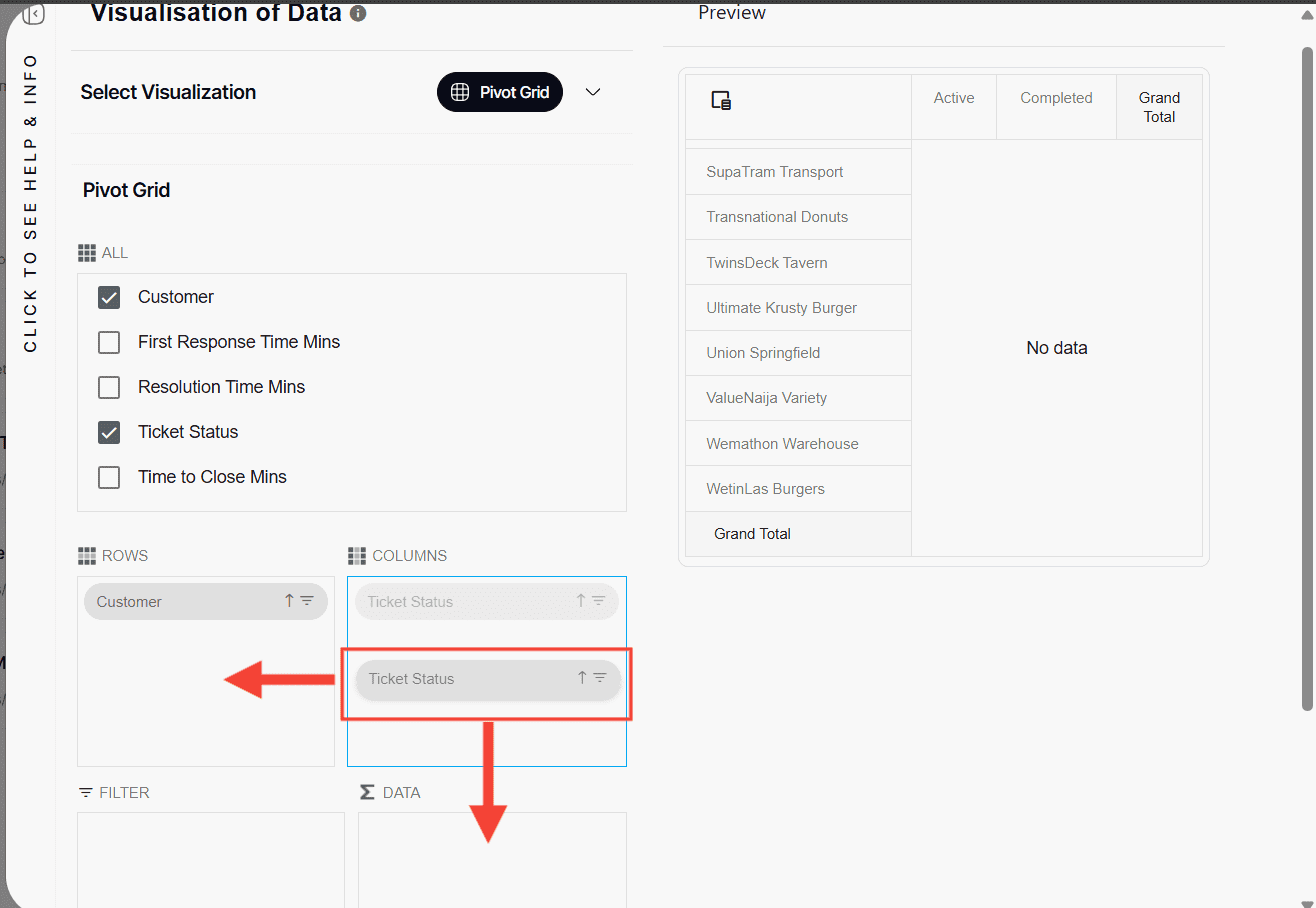
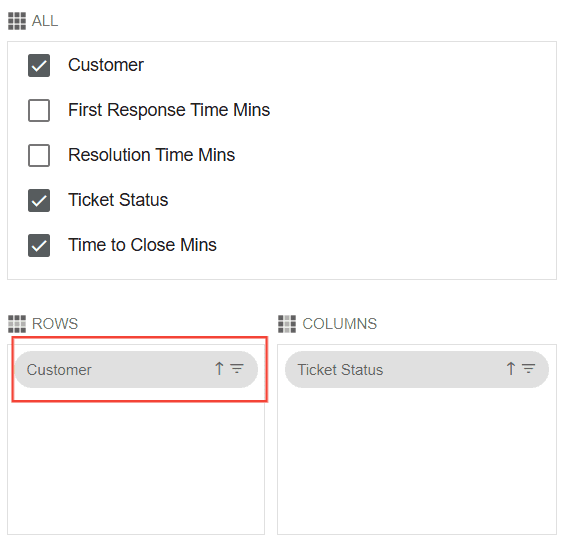
You can also drag the fields in ALL to the section you want them: COLUMNS, ROWS, OR DATA.
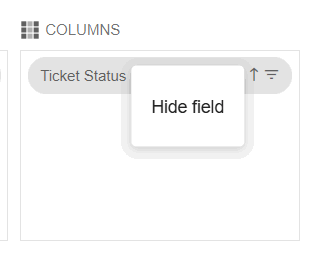
9. Under ROWS, COLUMNS and DATA, when you right click the fields under them, hide field option will appear. Clicking this will remove the field from the report.
10. Under DATA, you can configure the field by right clicking it.
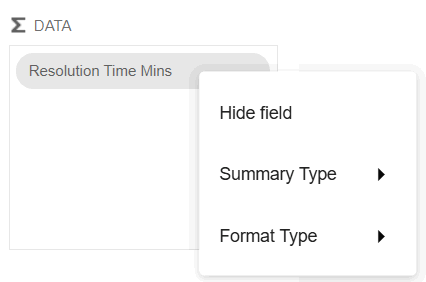
11. Aside from the Hide Field option, Summary Type and Format Type will be included in the options. You can choose your configuration based on the field you have selected.
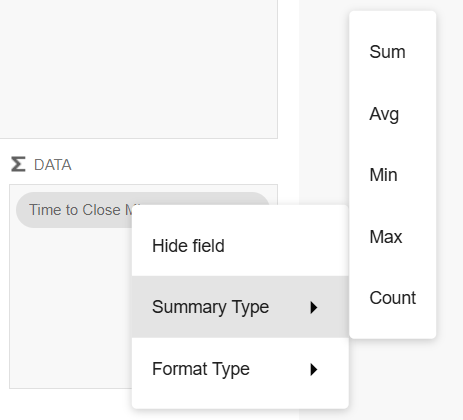
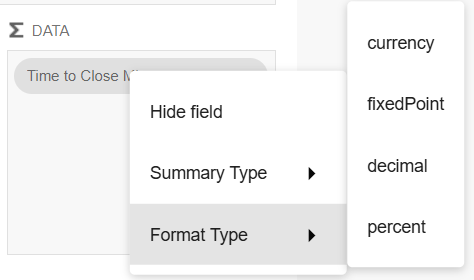
12. Any configurations made on these boxes will appear in the preview section in real time.
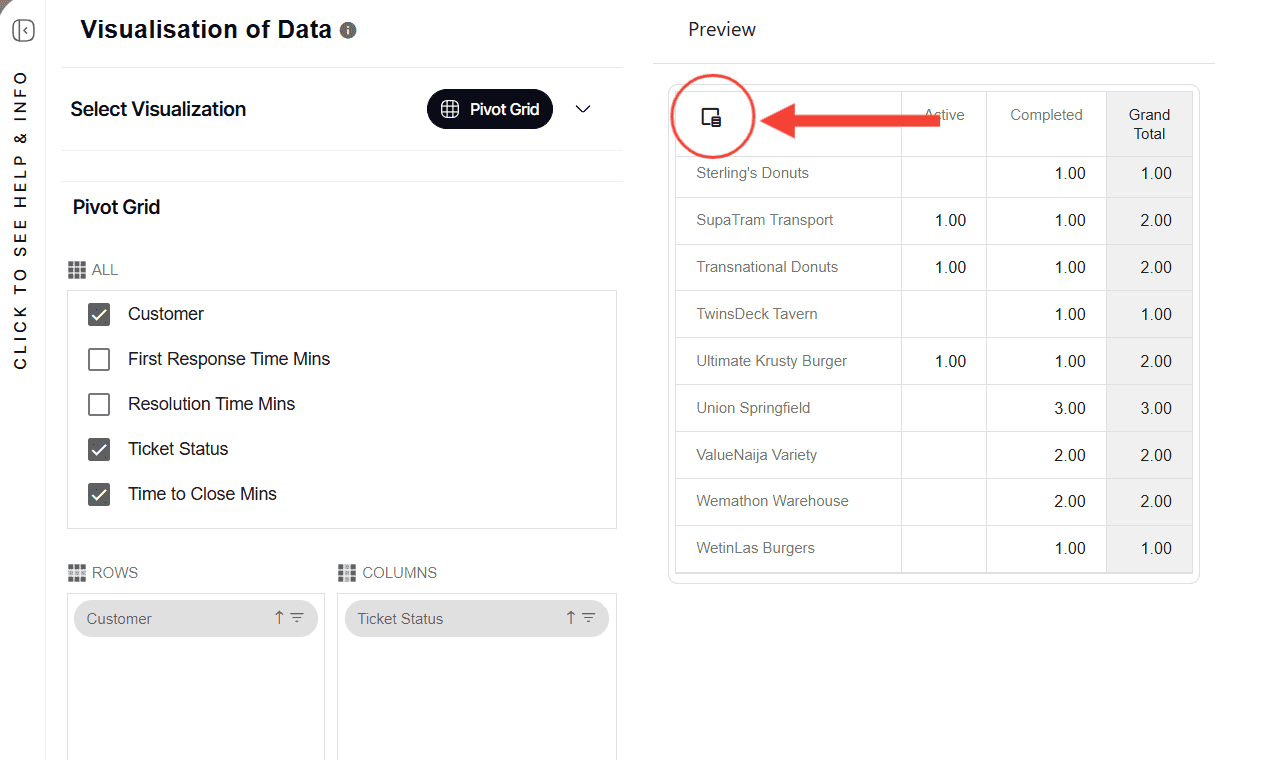
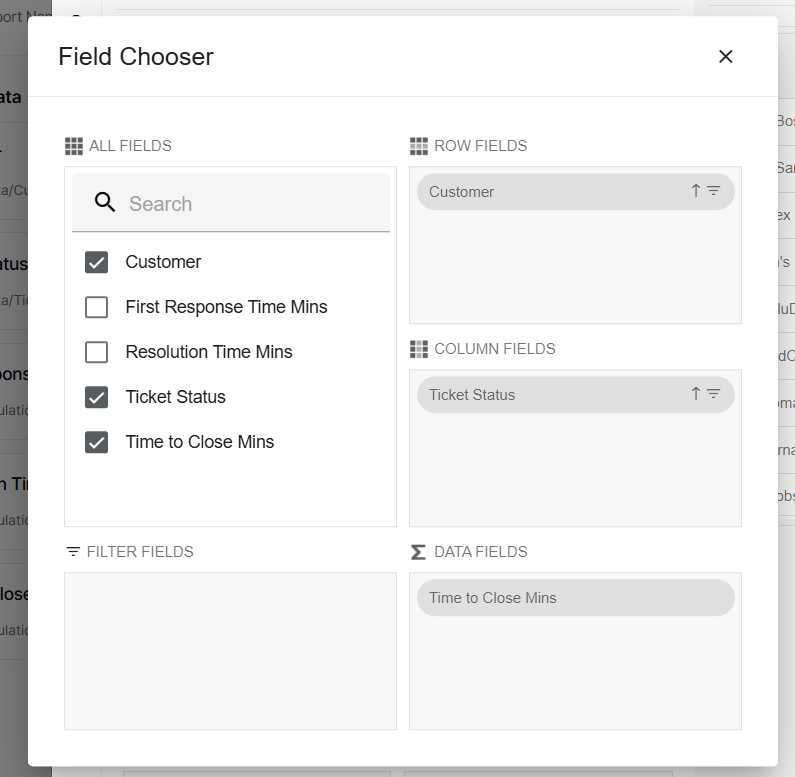
13. You can also select the Show Field Chooser, to configure the report.
14. Once satisfied, click Save & Apply

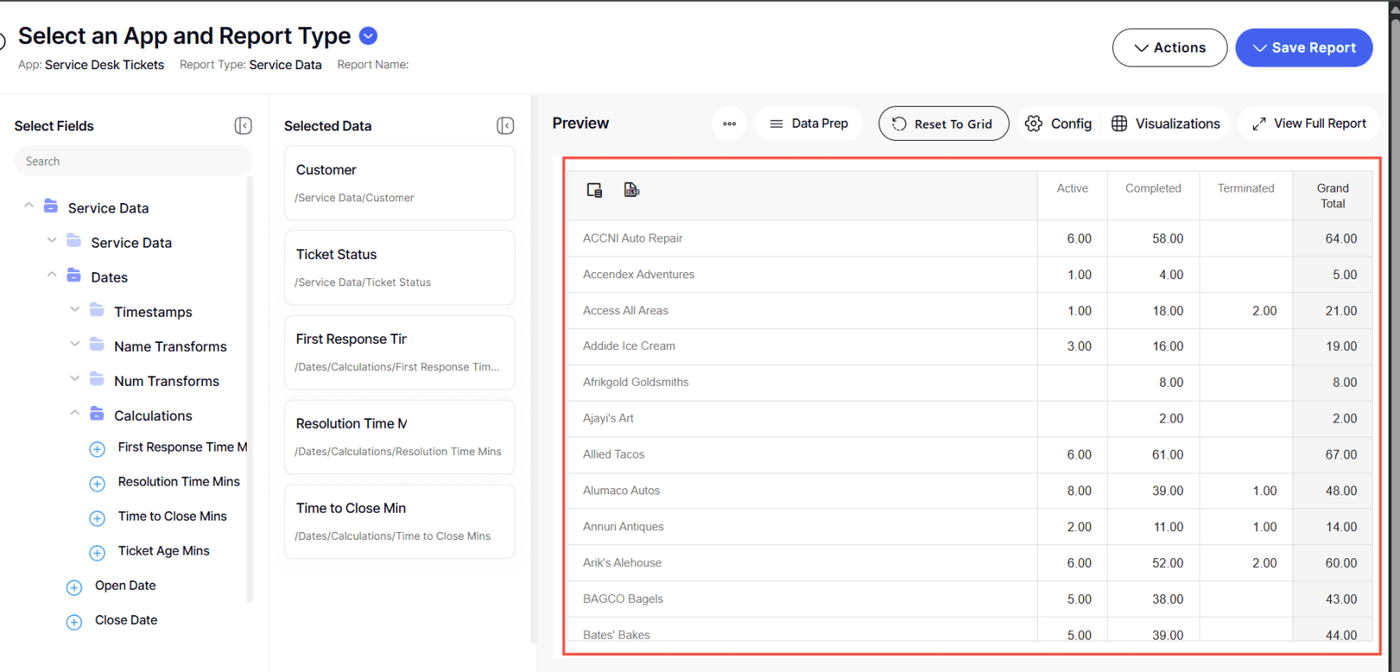
15. In the Preview Section of the builder, you can see the pivot grid you have configured
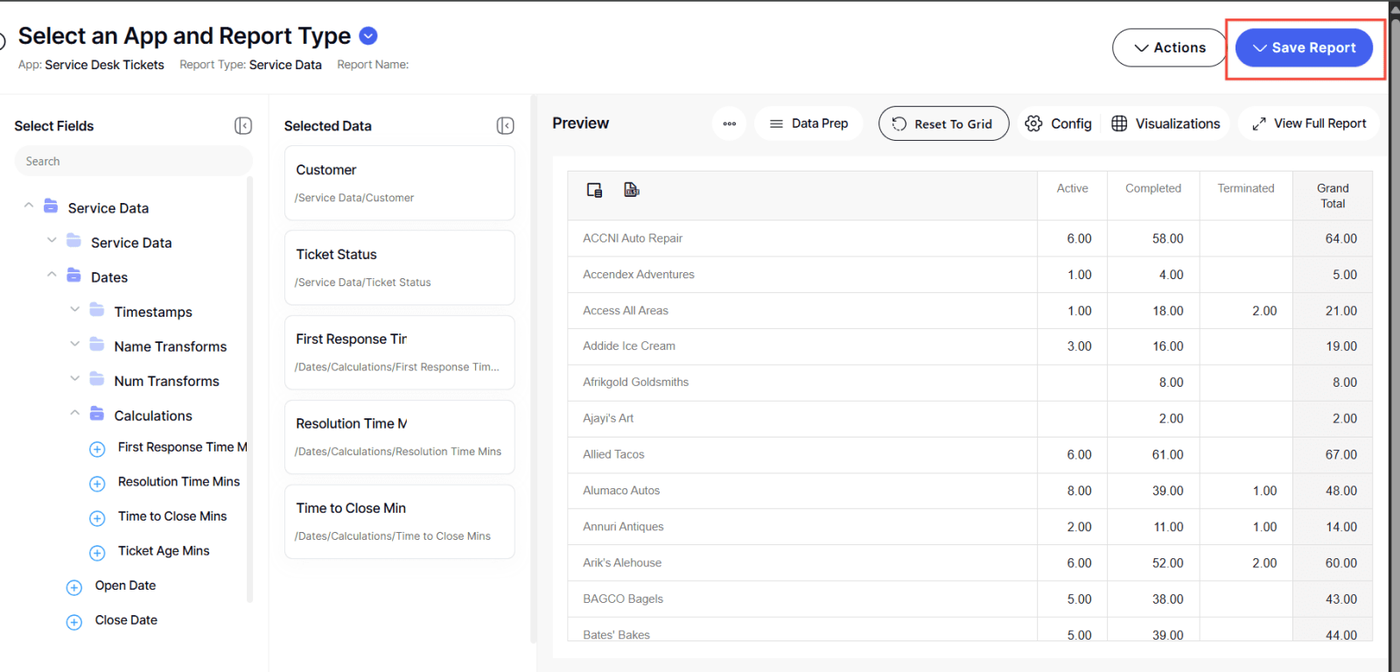
16. Click Save Report
Here is an article on how to save a report
And there you have it! You now know how to create an advanced pivot grid report from scratch and as well as edit it when needed!